01DATA02STORY03TIMELINE04MOTION05VIDEO

开源动效模板 · v0.1 预览

让数据踩准每一帧

输入 · CSV / JSONSCRUB · ANY FRAMEBUILT FOR HYPERFRAMES

把数据变成可编辑视频

为你的 AI 智能体而生,由 HyperFrames 驱动。

Give your AI agent a CSV, JSON, URL, API, or named public data source. Plotbeat retrieves or maps the data into a reusable, editable HyperFrames video project instead of an opaque export.

single-line-story18 sec
01 · Signal NoirOne template shown in one of eight light and dark styles.
36ROWS MAPPED

从这里开始

一个技能
任意数据

安装 Plotbeat,然后附上文件或指定数据源。技能会处理获取、模板选择、字段映射、节奏、验证和 HyperFrames 项目。

安装 Plotbeat
$npx skills add DbgKinggg/plotbeat --skill plotbeat
示例提示词

使用 $plotbeat 从 FRED 获取过去 10 年的美国月度失业率数据,注明数据序列和获取日期,然后制作一段节奏明快、可编辑的 HyperFrames 趋势视频。帮我选择视觉风格,并在渲染前让我确认。

一种动效语法 · 多套视觉系统

选择
画面气质

同一份数据,不同的表达方向。

FilterEvery thumbnail is a real HyperFrames capture.
HyperFrames-rendered frame in the Signal Noir style
HyperFrames capture00:13.5 / 00:18.0

认识
数据织机

数据行输入。
图表帧输出。

Rows enter as structured cells. A visible timing machine turns them into motion, then releases finished chart frames.

CODE-NATIVE / 01Live data → timeline → chart frames

动效语法 · 8 ready

选择
图表叙事

选择一种动效语法。

Every template is a real HyperFrames composition with frozen sample data, a clear input contract, seek-safe motion, eight visual styles, and a polished finale.

LIBRARY / 01
01
Rendered motion preview of the Single-line Story HyperFrames template
真实渲染示例

wide data · date + value

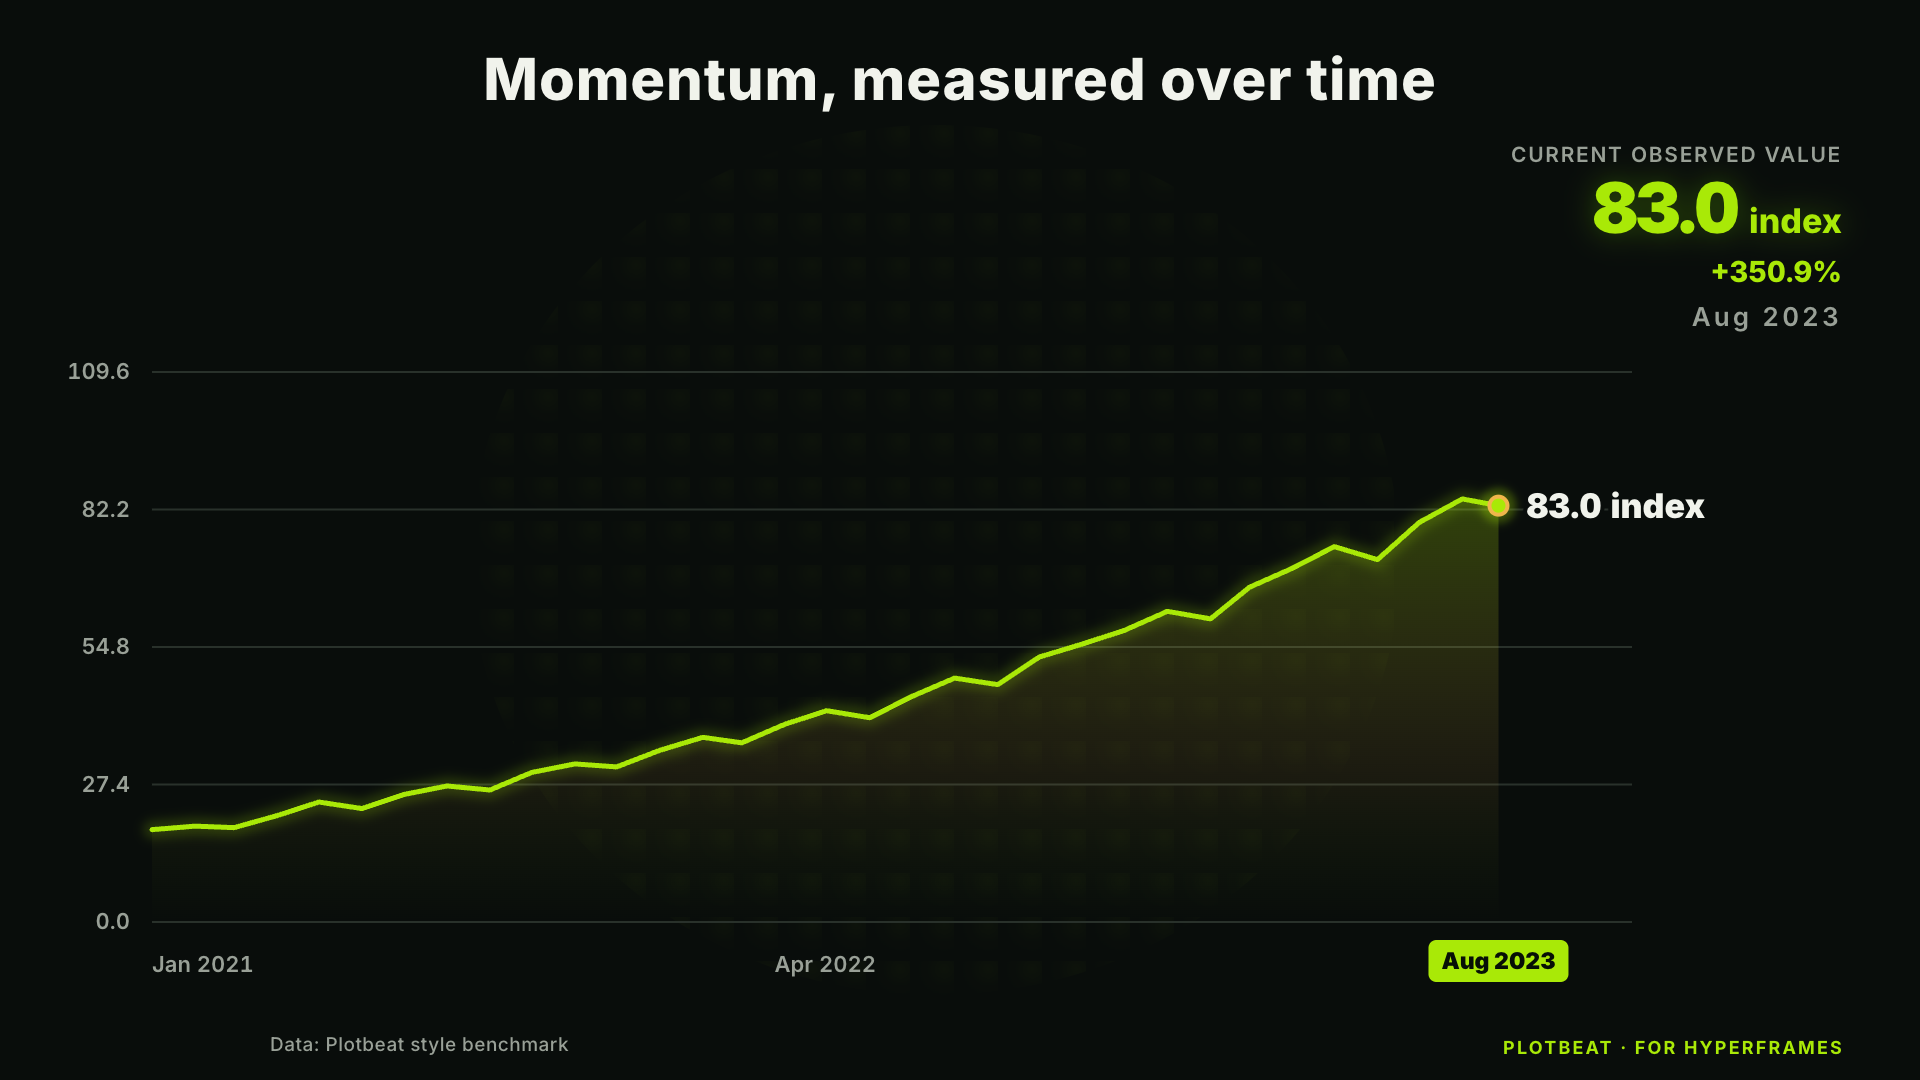
Single-line Story

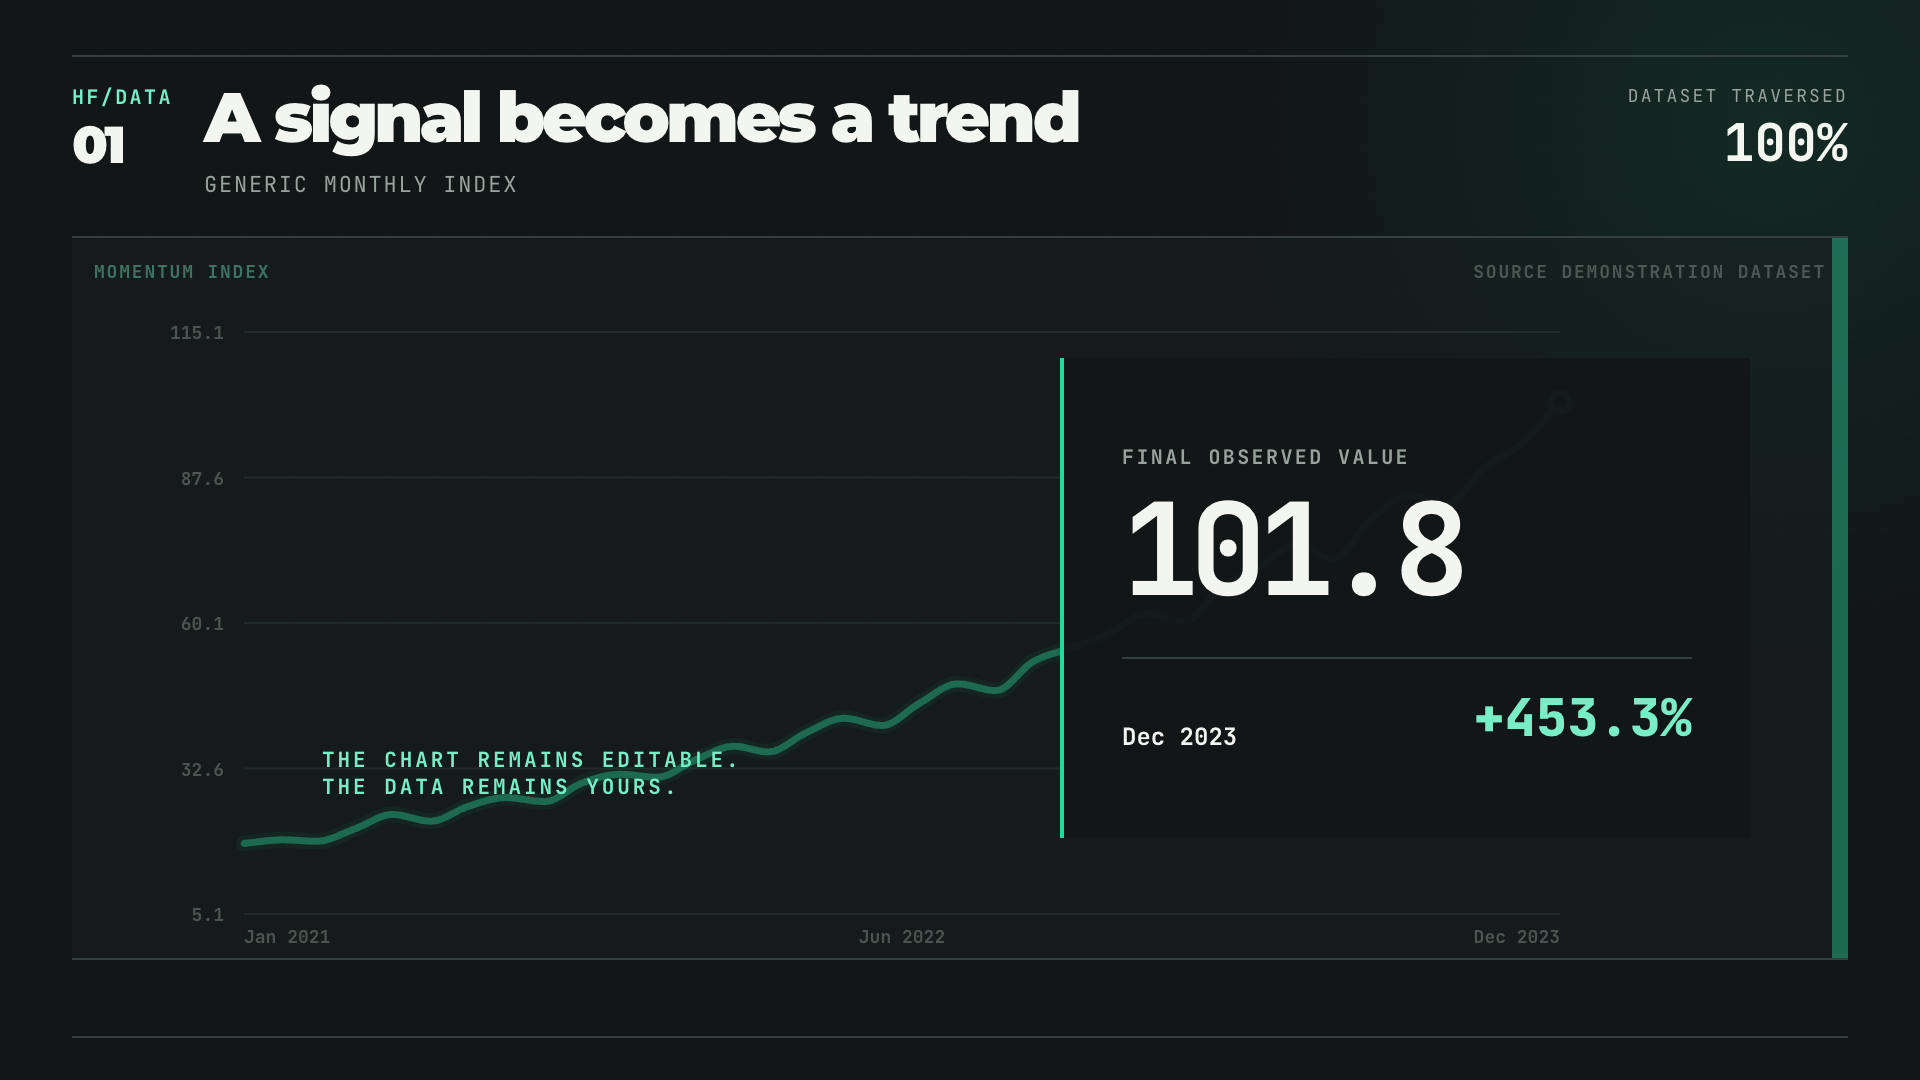
A single time series grows across the frame with a live endpoint readout and a decisive final lockup.
  • Linear trace
  • Smooth trace
02
Rendered motion preview of the Multi-line Rank HyperFrames template
真实渲染示例

long data · date + series + value

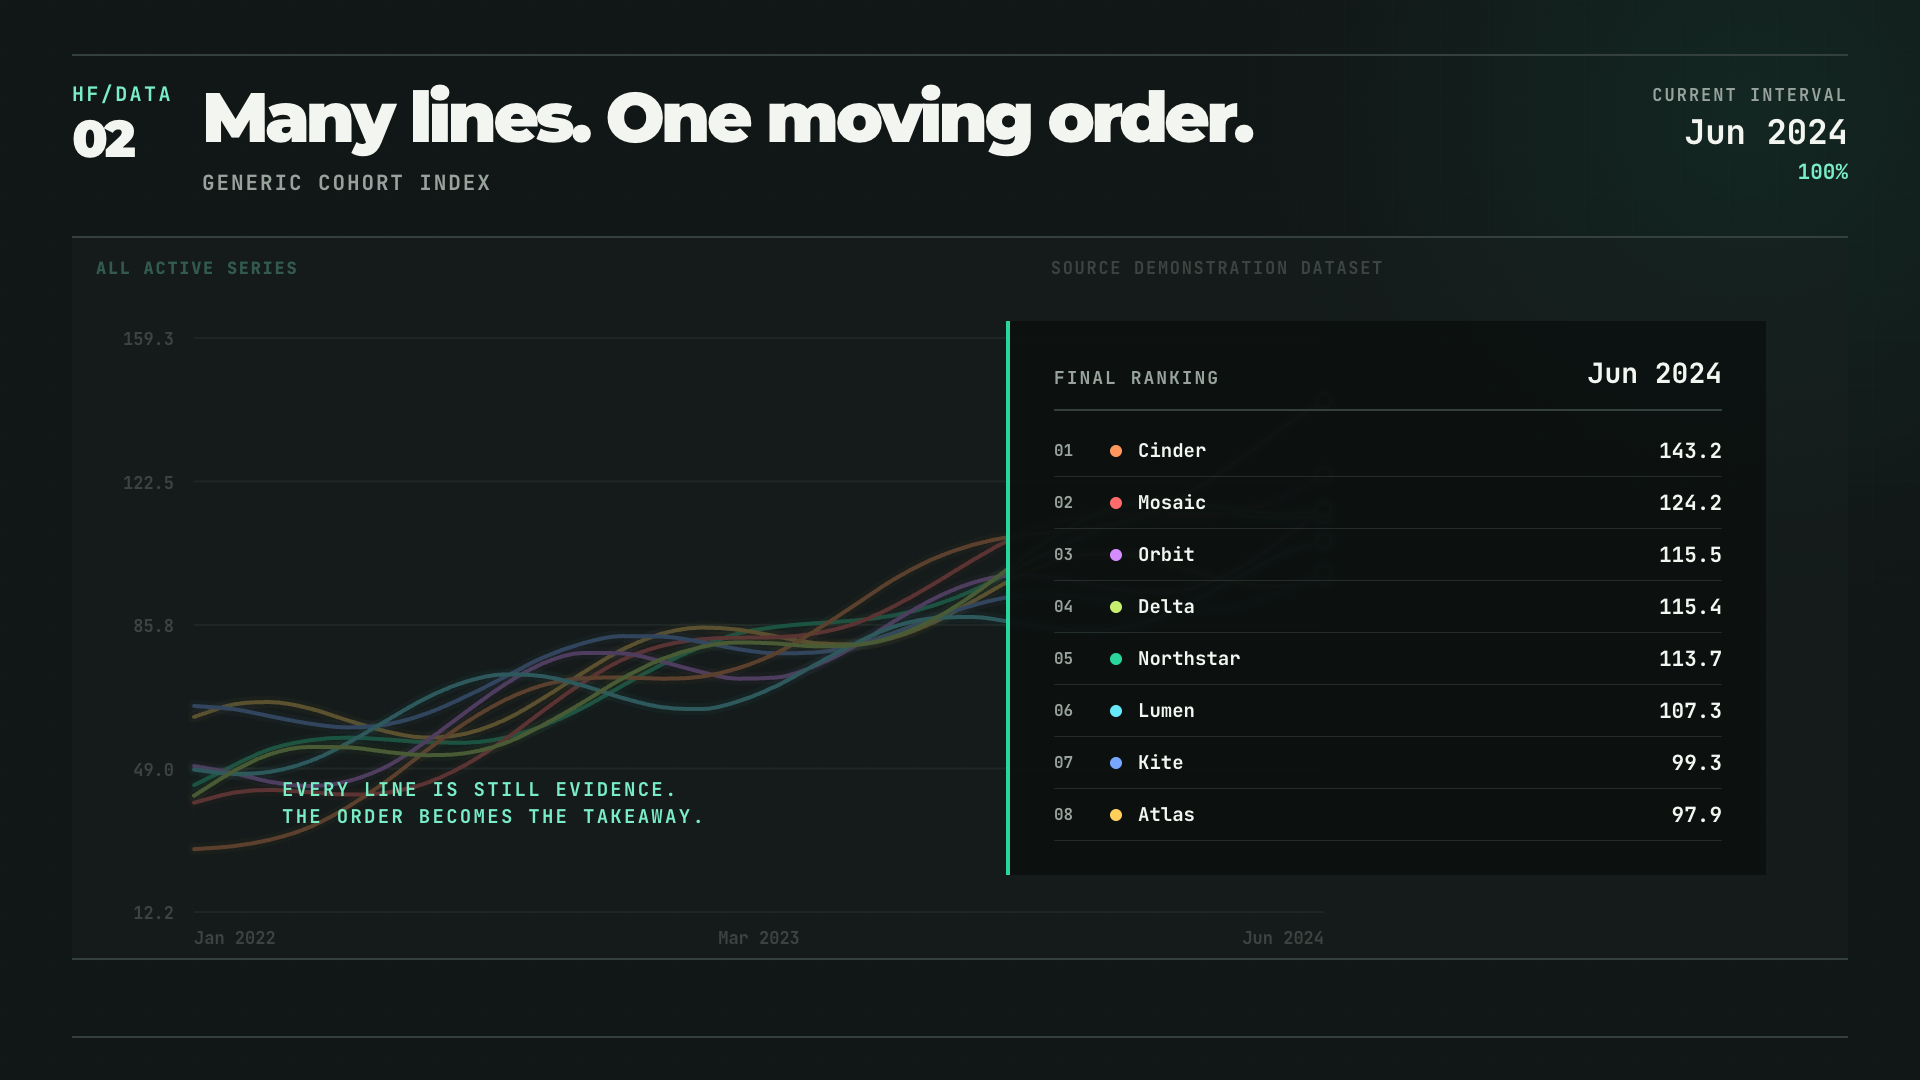
Multi-line Rank

Multiple time series grow together while a live legend glides through rank changes, followed by a final table.
  • Full field
  • Top five
03
Rendered motion preview of the Bar Race HyperFrames template
真实渲染示例

long data · date + series + value

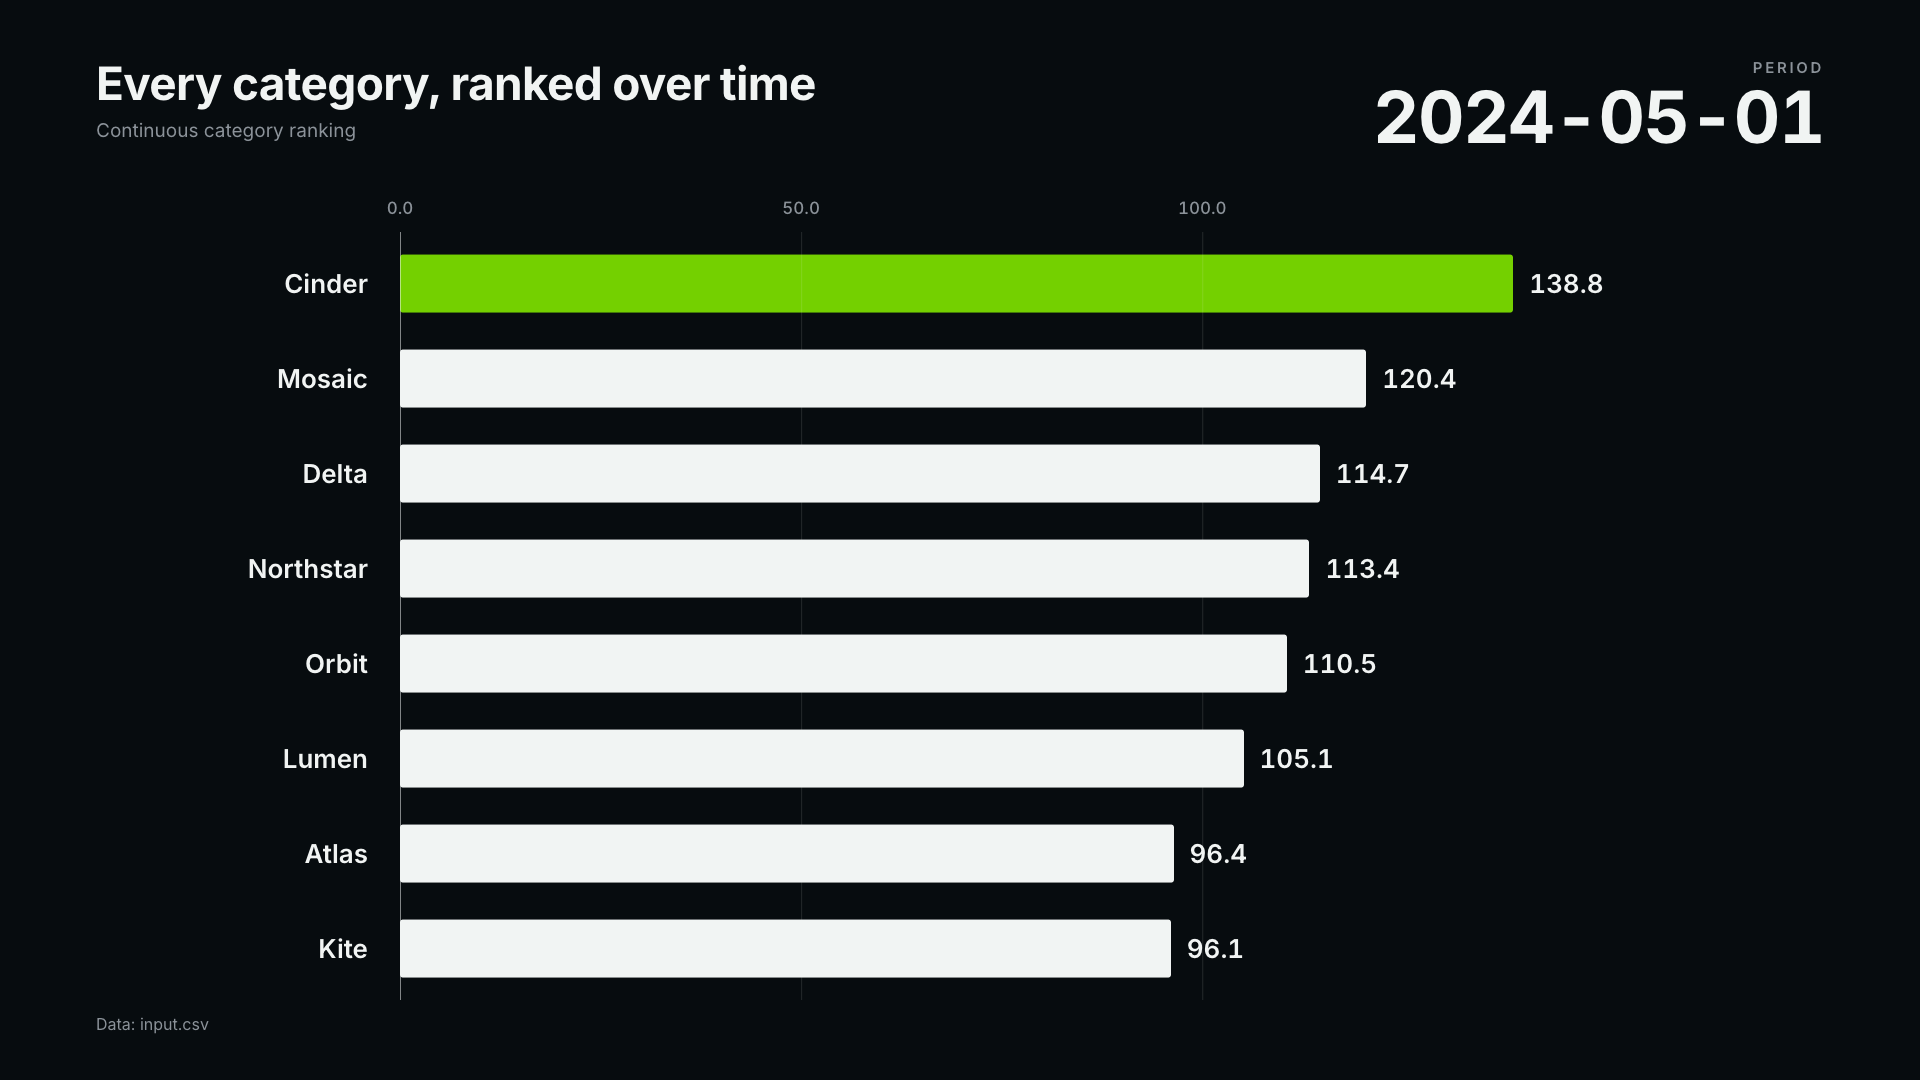
Bar Race

Ranked horizontal bars trade places over time while the scale and current-period readout update continuously.
  • Absolute values
  • Leader indexed
04
Rendered motion preview of the Stacked-area Story HyperFrames template
真实渲染示例

long data · date + series + value

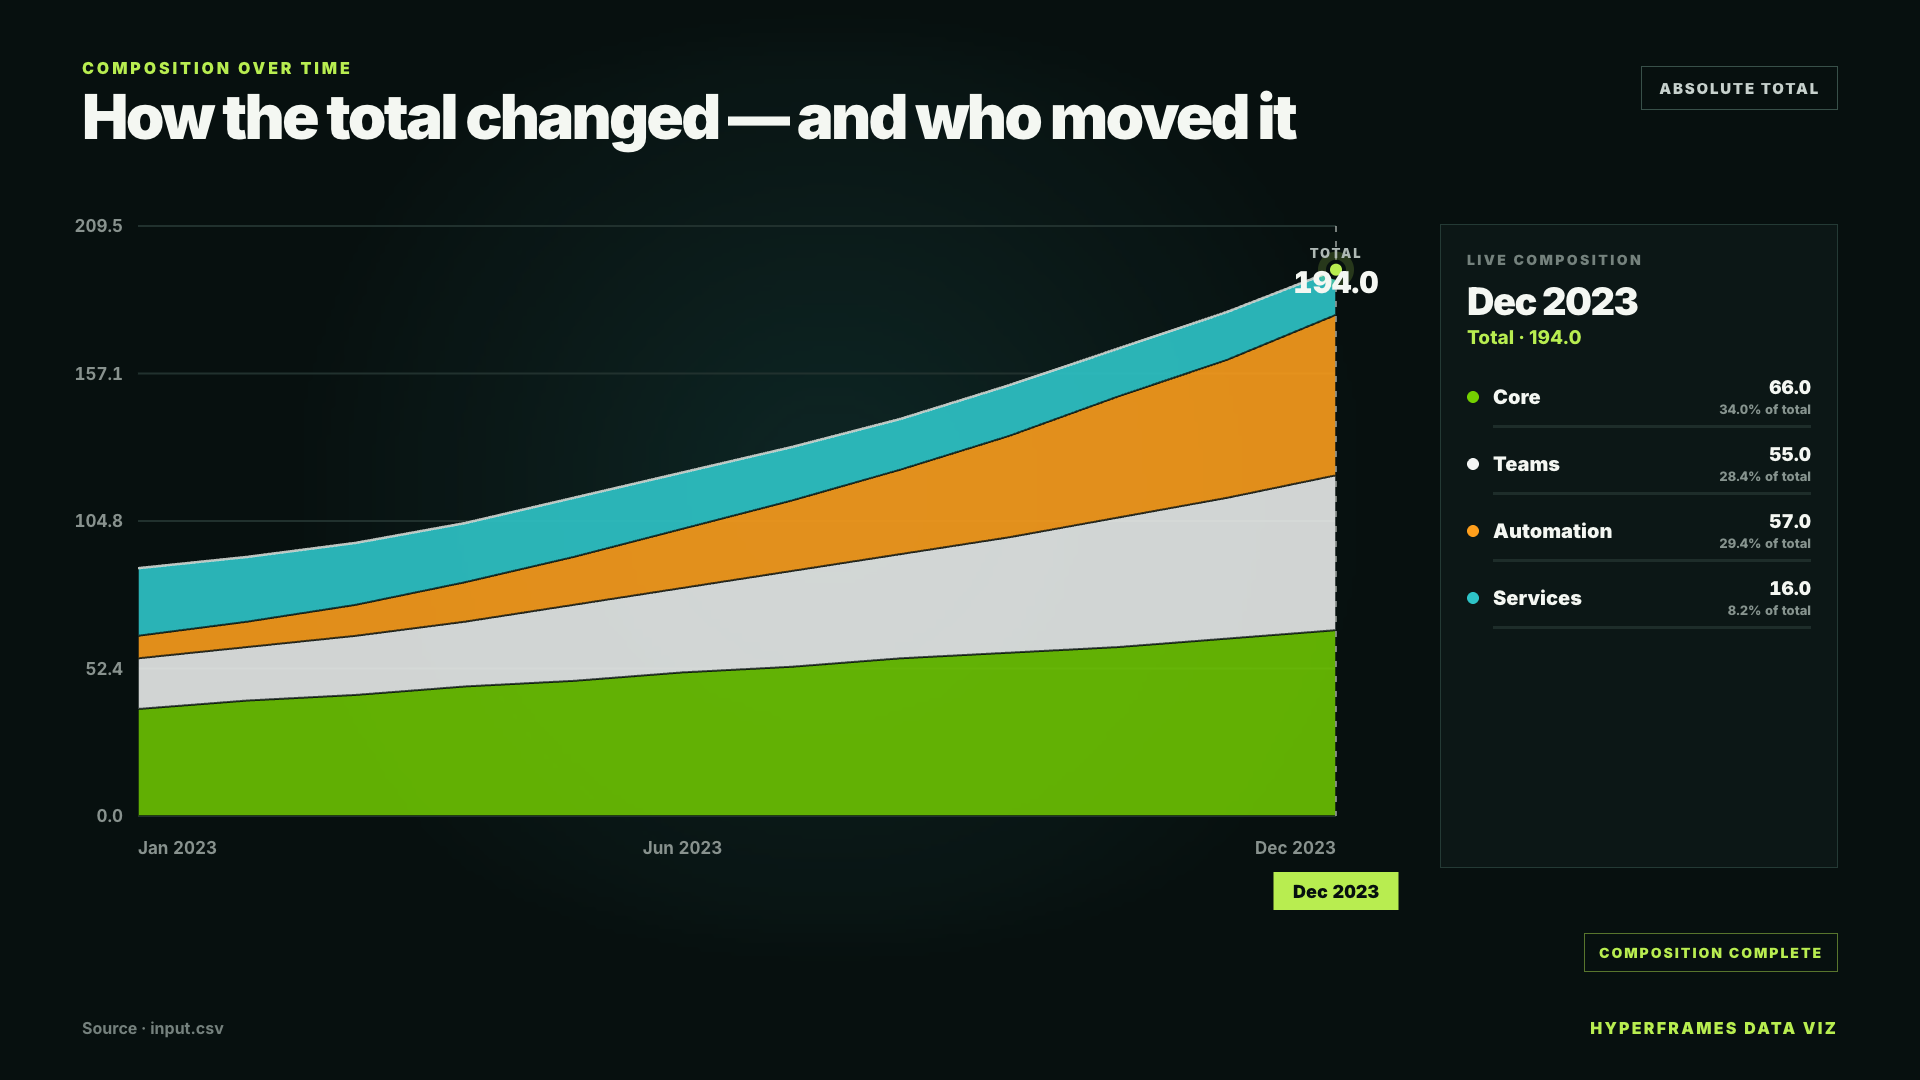
Stacked-area Story

Multiple time series accumulate into a flowing stacked-area composition with absolute and percentage views, live mix readouts, and a polished finale.
  • Absolute total
  • 100% composition
05
Rendered motion preview of the Scatter Journey HyperFrames template
真实渲染示例

long data · date + series + x + y

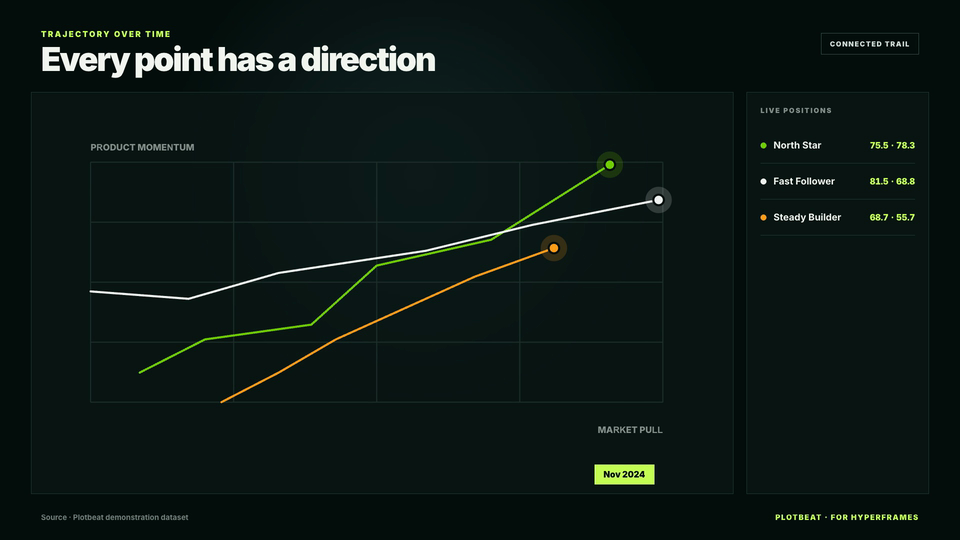
Scatter Journey

Entities move through two-dimensional space over time with connected trails, live coordinates, and optional bubble sizing.
  • Connected trail
  • Bubble trail
06
Rendered motion preview of the Animated Map HyperFrames template
真实渲染示例

location rows data · location + latitude + longitude + value
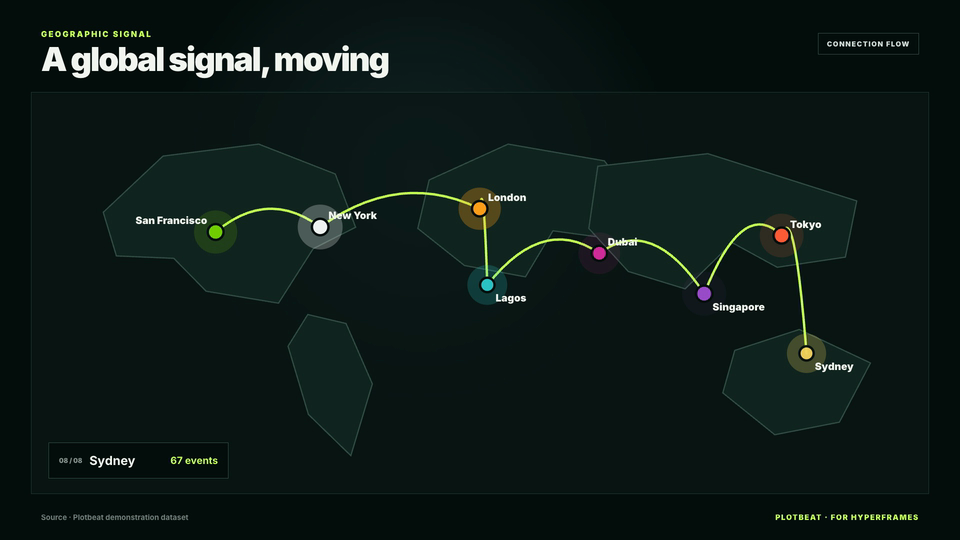
Animated Map

Locations pulse across a stylized world map while optional connection flows and live intensity readouts build the geographic story.
  • Location pulse
  • Connection flow
07
Rendered motion preview of the KPI Dashboard HyperFrames template
真实渲染示例

metric rows data · metric + value + target + change
KPI Dashboard

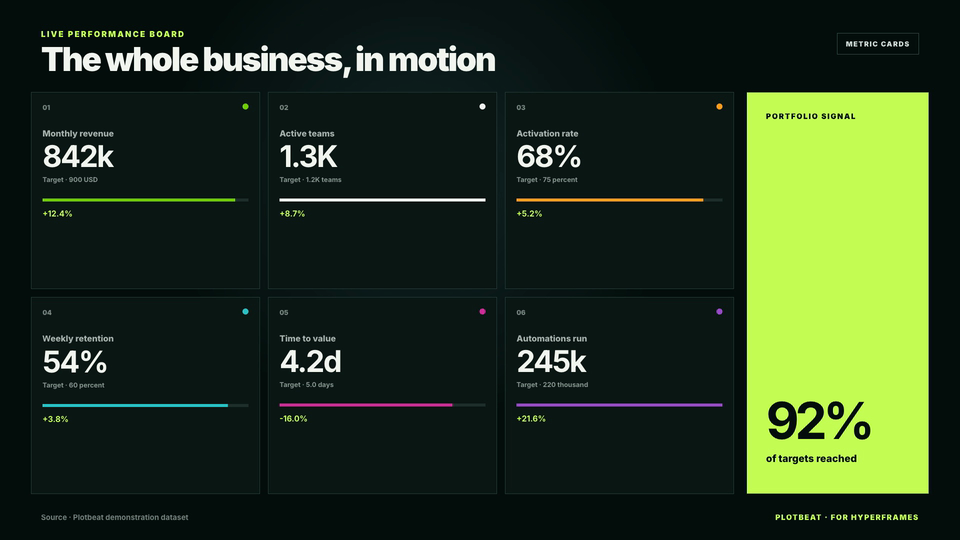
A cinematic performance board stages multiple KPIs, target progress, and direction of change without feeling like a static dashboard.
  • Metric cards
  • Radial progress
08
Rendered motion preview of the Milestone Timeline HyperFrames template
真实渲染示例

event rows data · date + title

Milestone Timeline

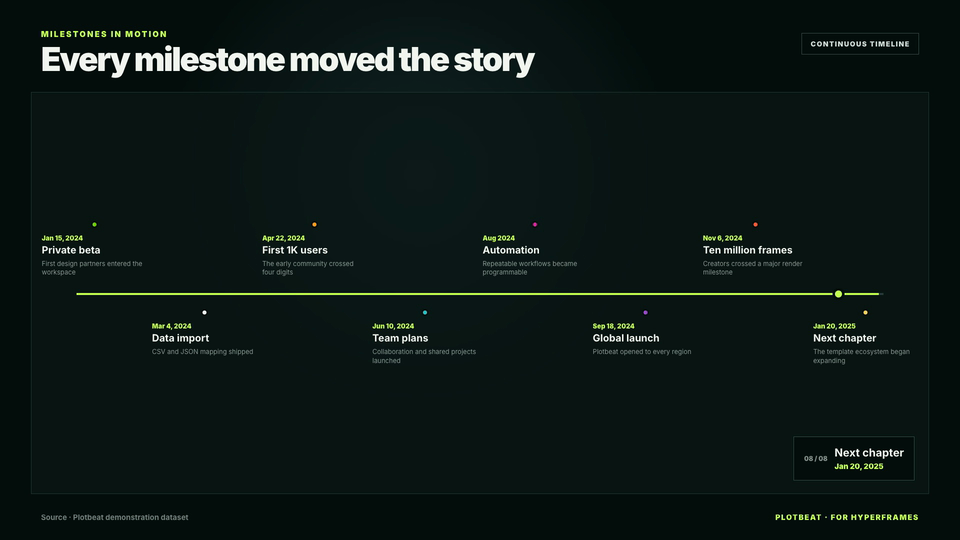
Events reveal across a continuous timeline with alternating chapter cards, a moving playhead, and a focused live milestone readout.
  • Continuous line
  • Chapter cards

清晰可见的制作流程

数据行输入
节拍输出

DATA → STYLE → TIMELINE
01

Map the rows

The skill inspects dates, series, units, missing values, and the story your data can honestly support.

02

Pick a grammar

Start from a proven chart composition instead of rebuilding the same motion language every time.

03

Choose the style

Select a polished light or dark visual system, or build your own palette, typography, and composition tokens.

04

Preview in HyperFrames

Your data is compiled locally into an ordinary, editable HyperFrames HTML project.

05

Approve + render

Check arbitrary seeks, tune the pacing in Studio, then let HyperFrames produce the final video.

底层引擎始终可见

构建于
HyperFrames

Remove HyperFrames and the product stops working. That is the point: the skill specializes the engine instead of quietly rebuilding its timeline, preview, or renderer.

CORE ENGINE
AI skillIntent → template + mappings
Template systemComposition + chart runtime
Prepared dataCleaned and ready to animate
HyperFrames engineTimeline · Studio · Check · Render

指导动效

告诉它
什么最重要

Choose the data and the narrative. The skill handles the repeatable setup, while you keep control of pacing, styling, and final Studio approval.

01趋势故事

使用 $plotbeat 从 FRED 获取过去 10 年的美国月度失业率数据,注明数据序列和获取日期,并以 Studio Blueprint 风格制作一段节奏明快的单折线 HyperFrames 视频。

02排名故事

使用 $plotbeat 将 cohorts.csv 制作成 Paper Cut 风格的多折线排名视频。按活跃用户数展示地区随时间的排名变化,只保留前八名,并以清晰的最终榜单收尾。

03地图故事

使用 $plotbeat 从 USGS GeoJSON 数据源获取最近 30 天内 5 级以上地震,以震级作为数值,并将地点制作成一段节奏明快的 Signal Noir 风格 HyperFrames 动态地图。