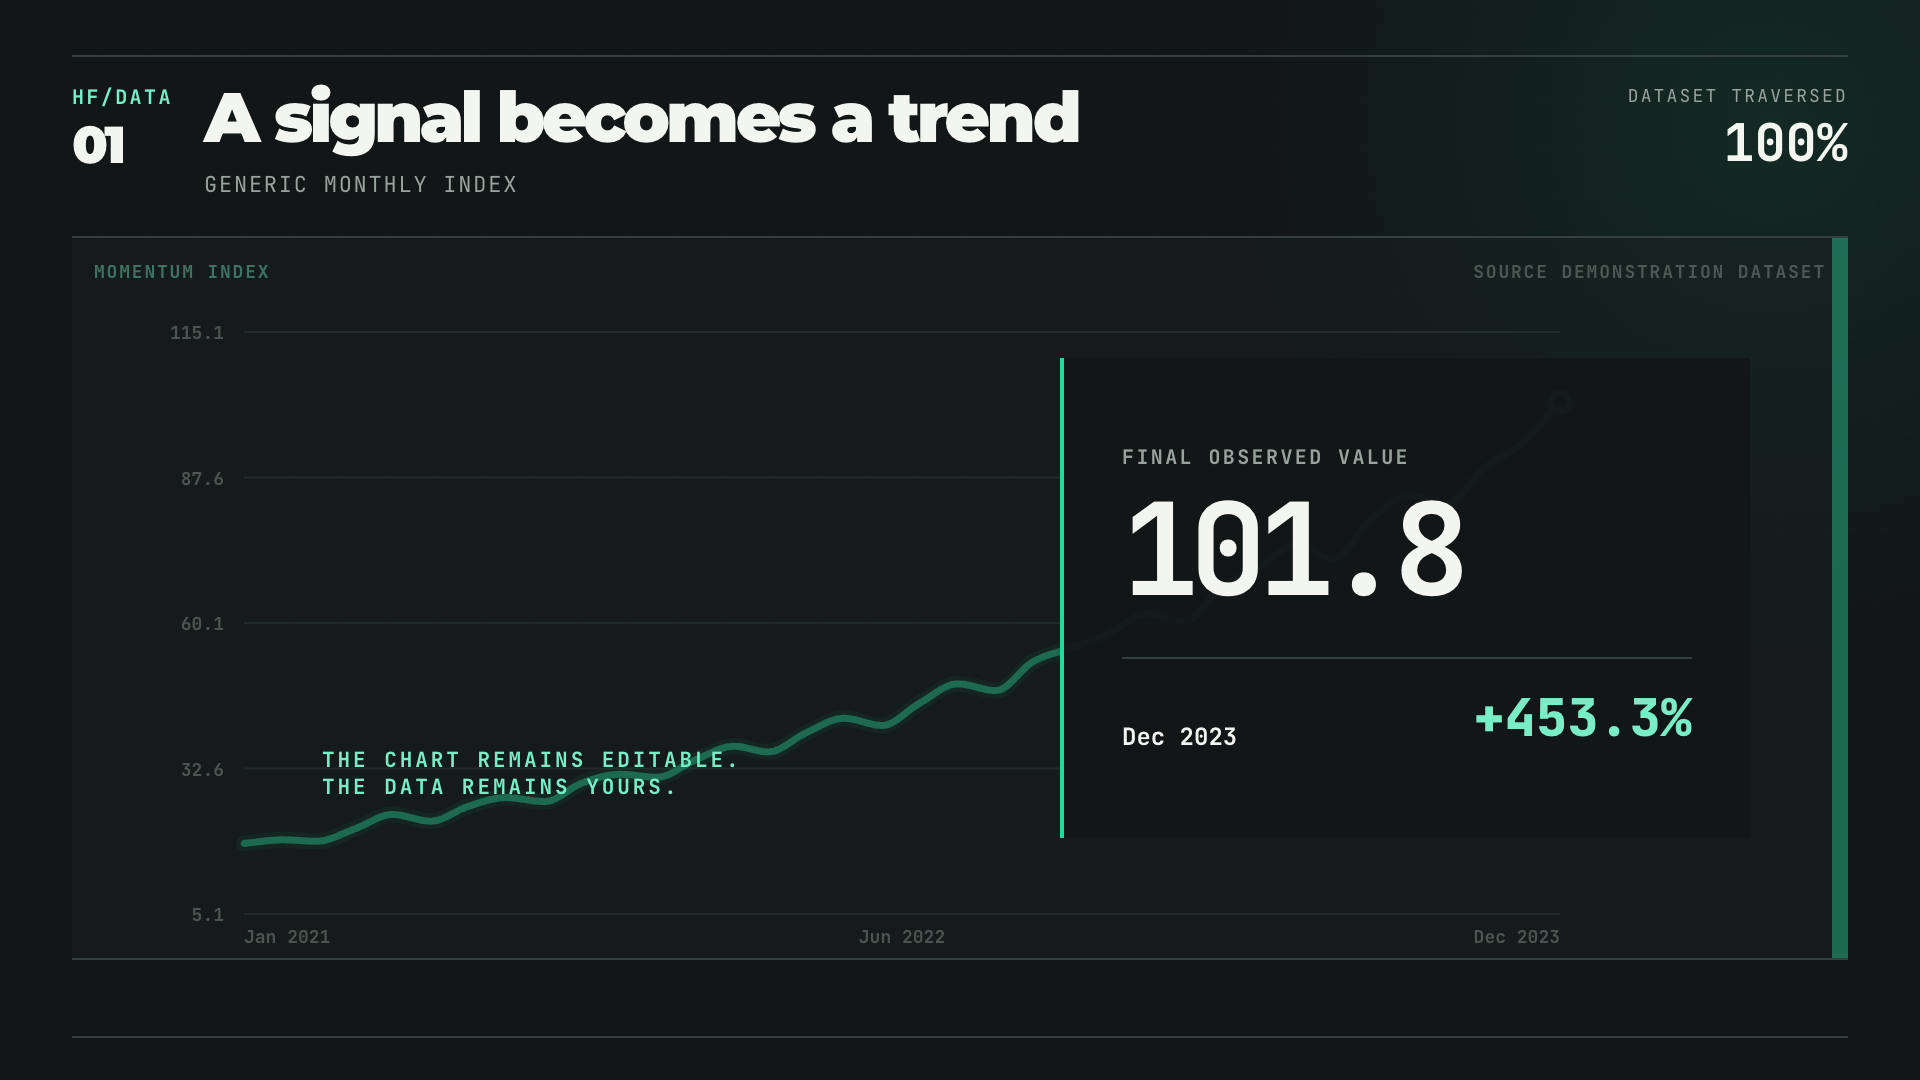
wide data · date + value
Single-line Story
A single time series grows across the frame with a live endpoint readout and a decisive final lockup.- Linear trace
- Smooth trace
Modèles de motion open source · Aperçu v0.1
Conçu pour votre agent IA. Propulsé par HyperFrames.
Give your AI agent a CSV, JSON, URL, API, or named public data source. Plotbeat retrieves or maps the data into a reusable, editable HyperFrames video project instead of an opaque export.
Commencez ici
Installez Plotbeat, joignez un fichier ou indiquez la source. La skill gère la récupération, le modèle, le mapping, le rythme, la validation et le projet HyperFrames.
npx skills add heygen-com/hyperframes --all
npx skills add DbgKinggg/plotbeat --skill plotbeatUtilisez $plotbeat pour récupérer sur FRED les données mensuelles du chômage aux États-Unis sur les dix dernières années, citez la série et la date de consultation, puis transformez-les en une vidéo de tendance HyperFrames rapide et modifiable. Aidez-moi à choisir le style visuel et demandez mon accord avant le rendu.
Une grammaire · plusieurs systèmes visuels
Mêmes données. Autre direction.
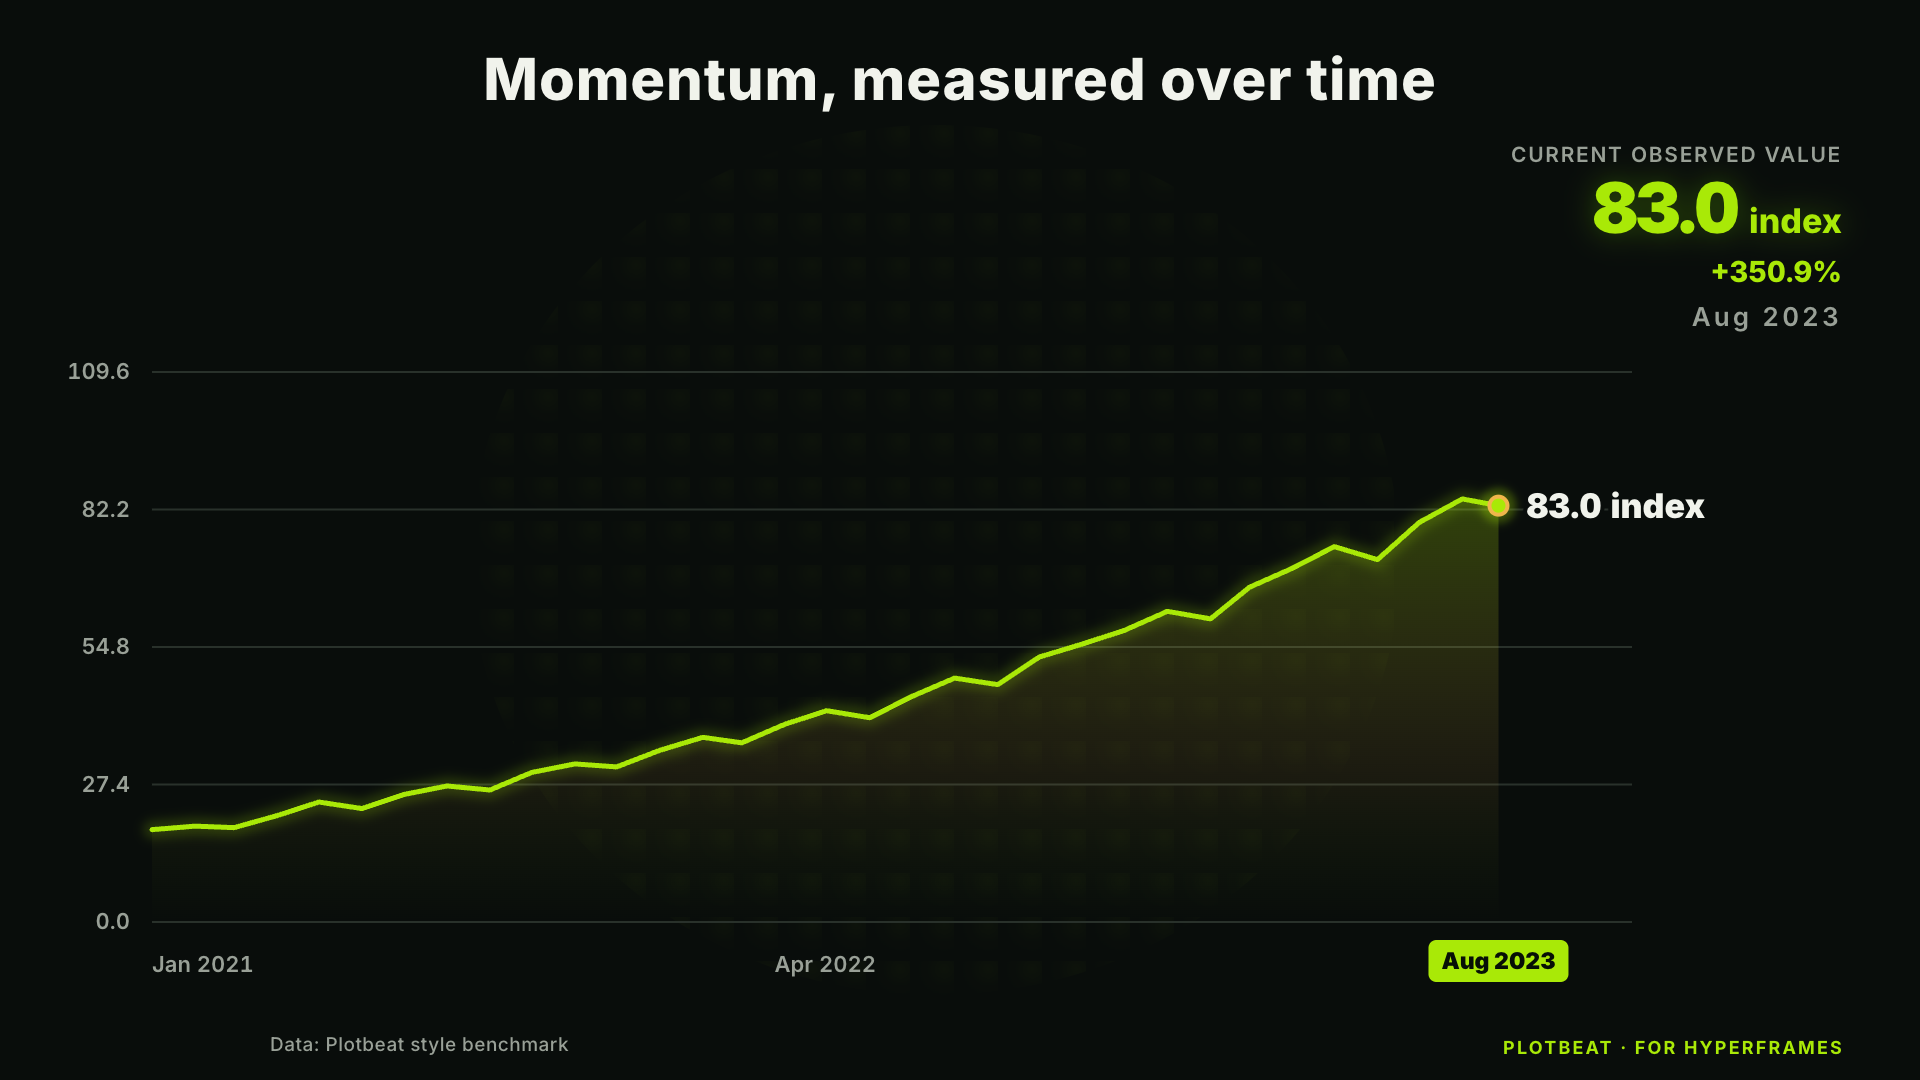
Lignes en entrée.
Images en sortie.
Rows enter as structured cells. A visible timing machine turns them into motion, then releases finished chart frames.
Grammaires de mouvement · 8 ready
Choisissez une grammaire de mouvement.
Every template is a real HyperFrames composition with frozen sample data, a clear input contract, seek-safe motion, eight visual styles, and a polished finale.
wide data · date + value
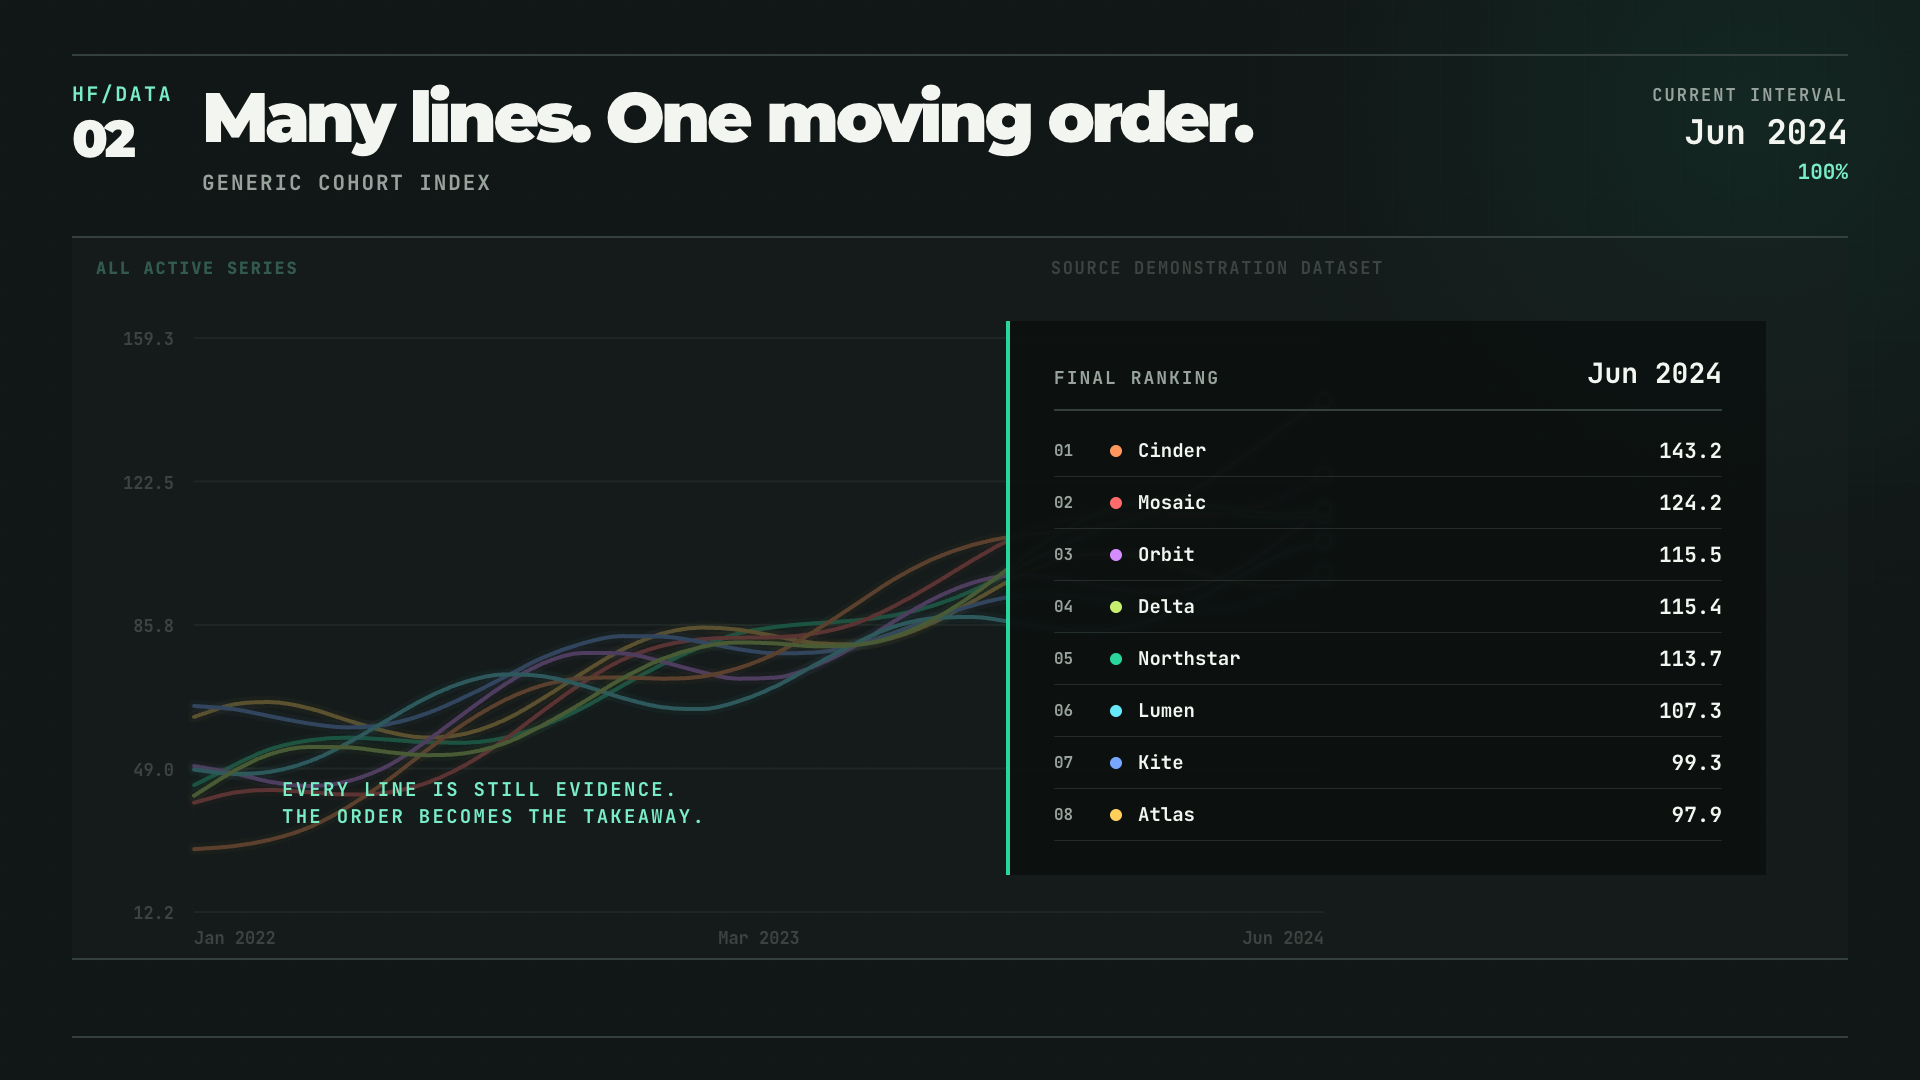
long data · date + series + value
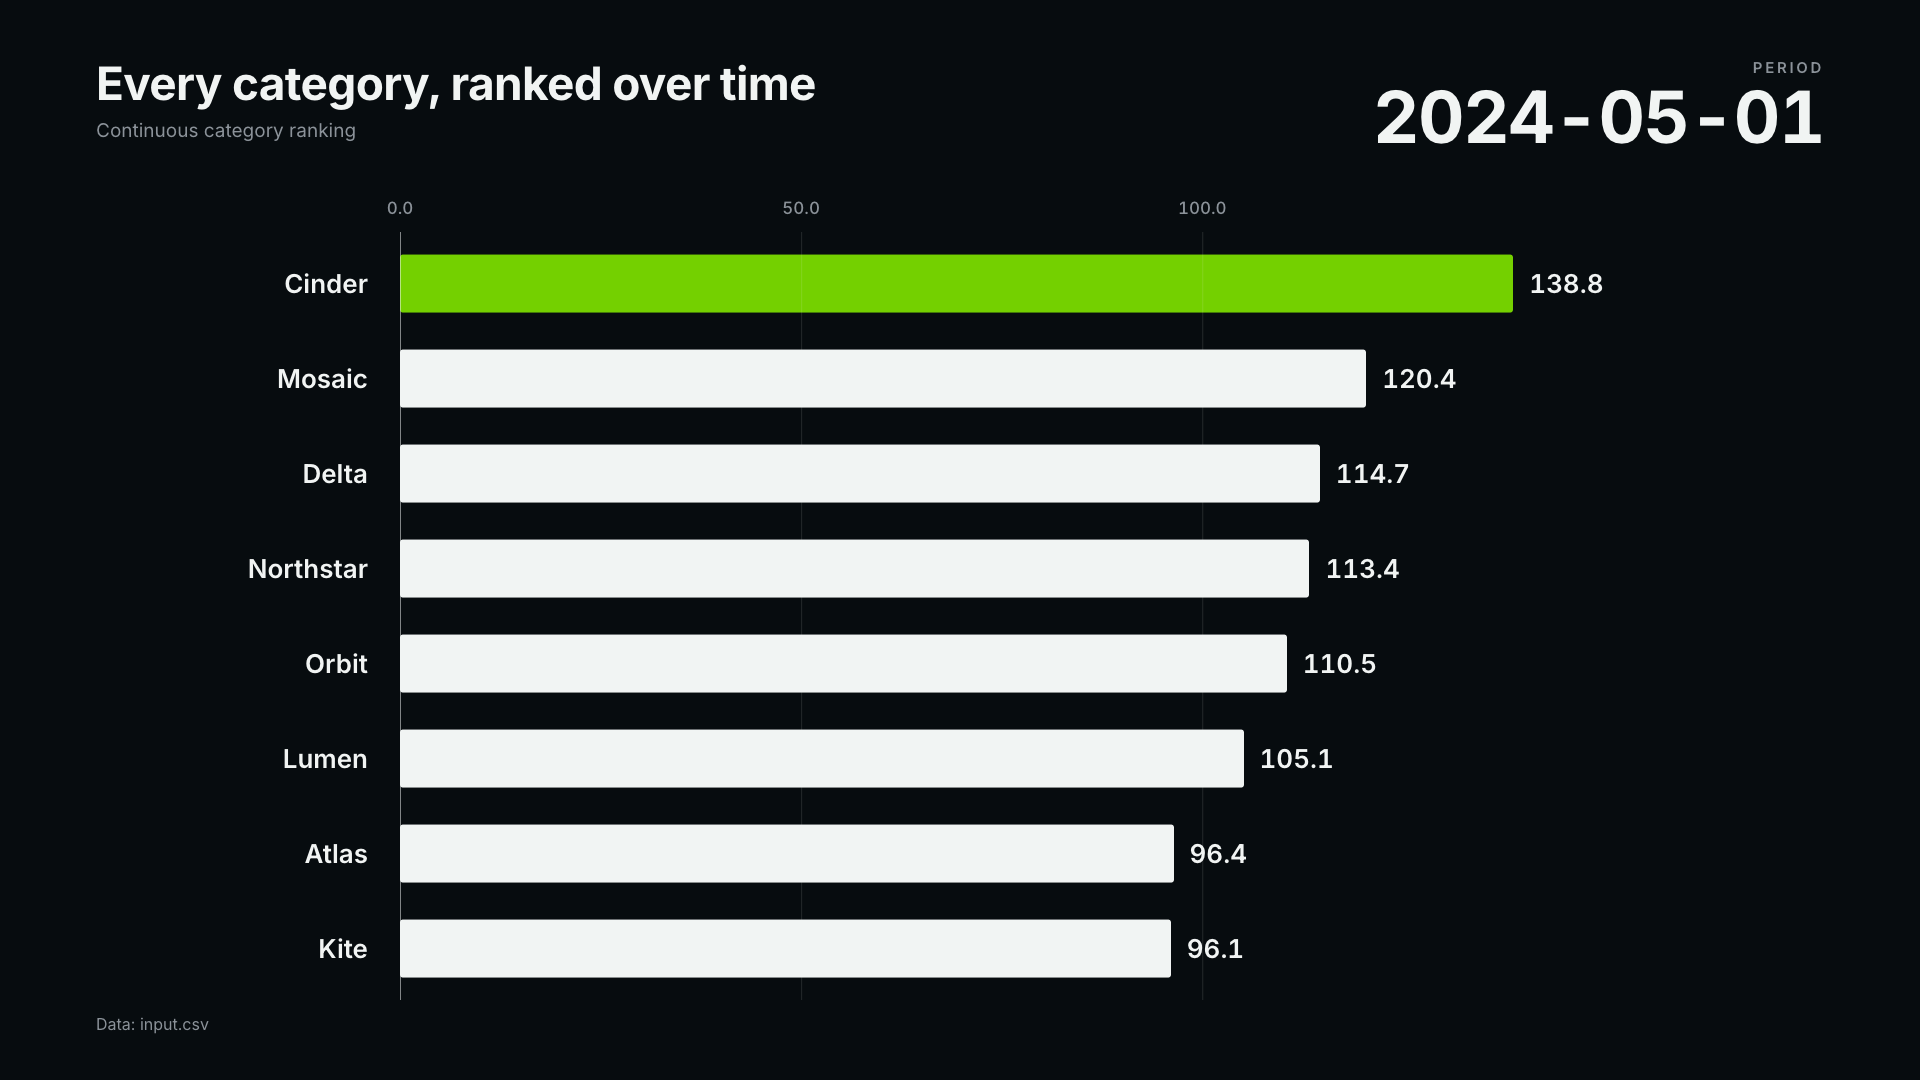
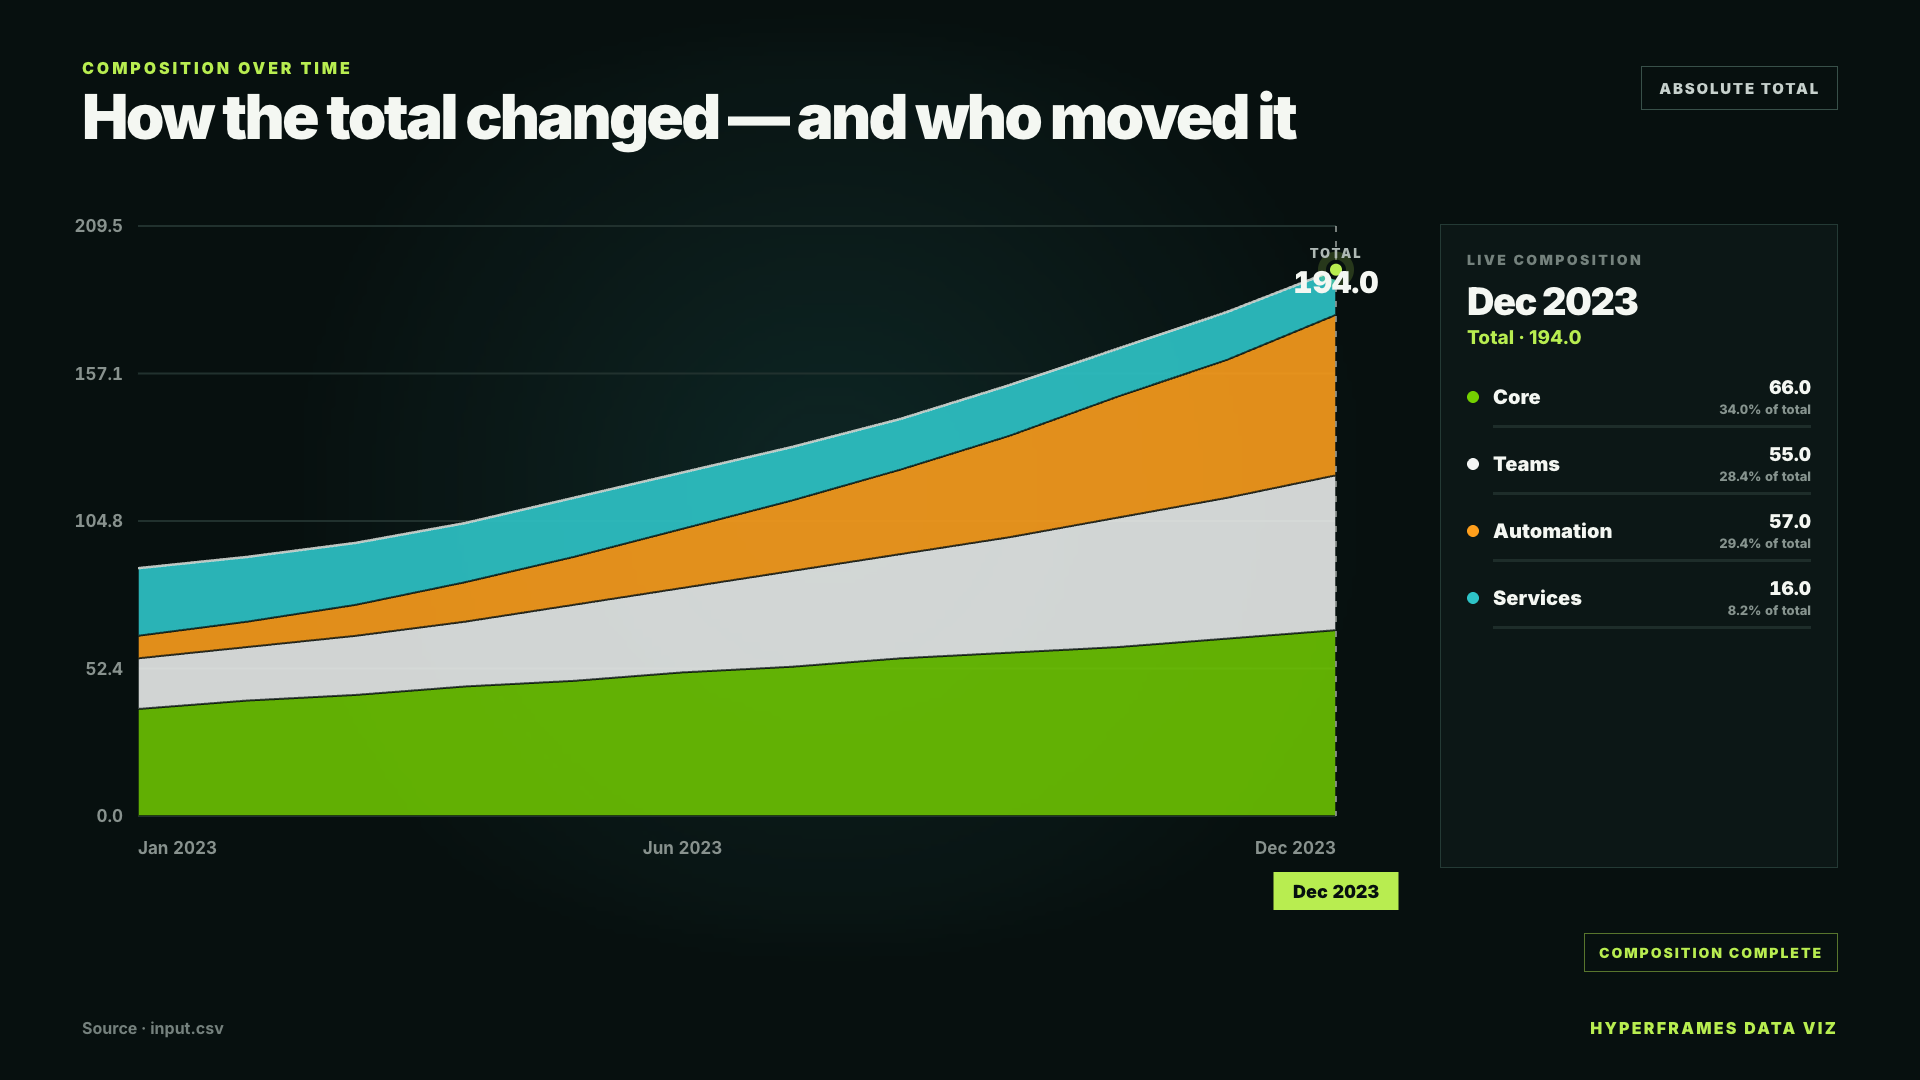
long data · date + series + value
long data · date + series + value
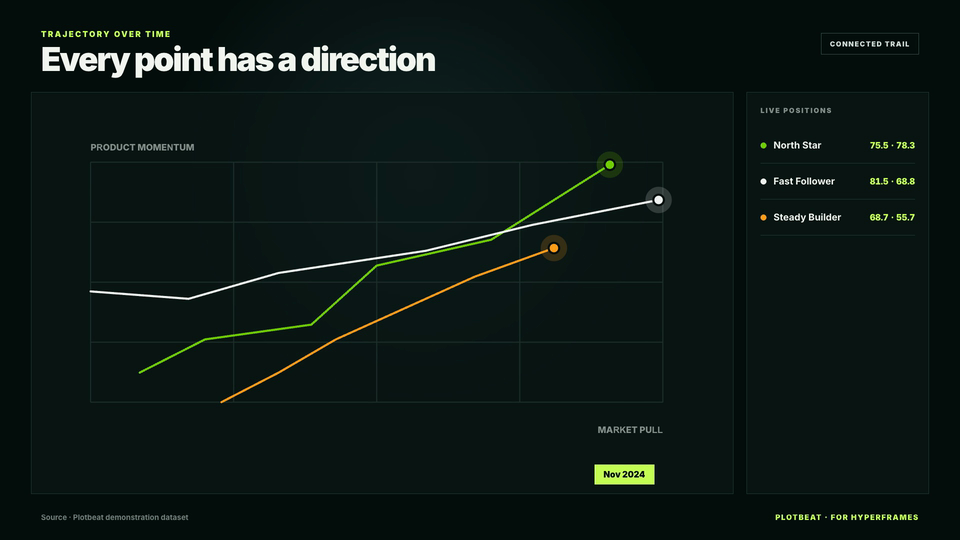
long data · date + series + x + y
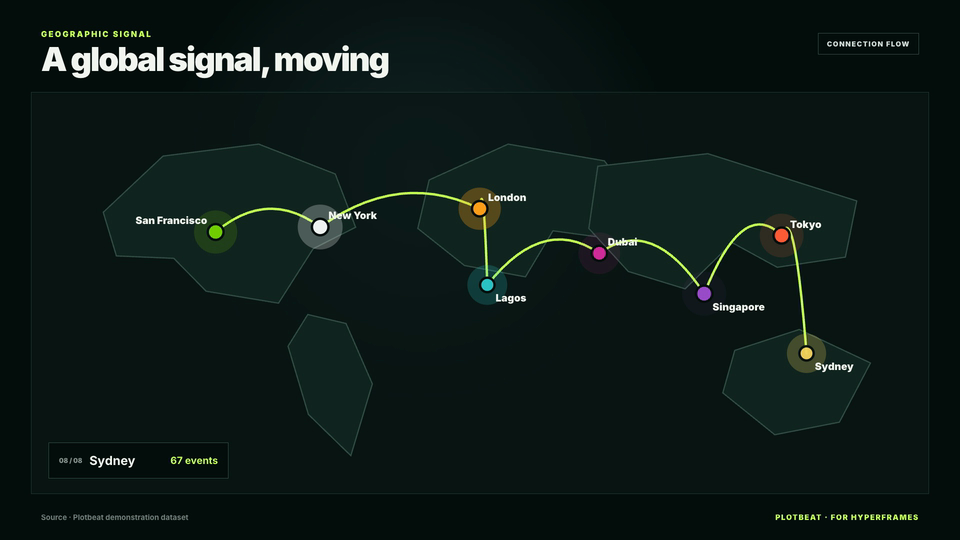
location rows data · location + latitude + longitude + value
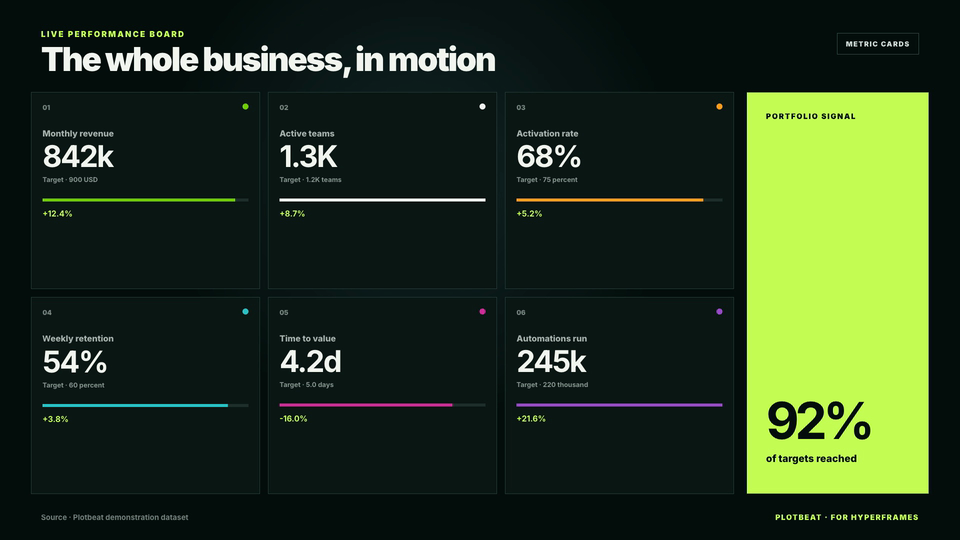
metric rows data · metric + value + target + change
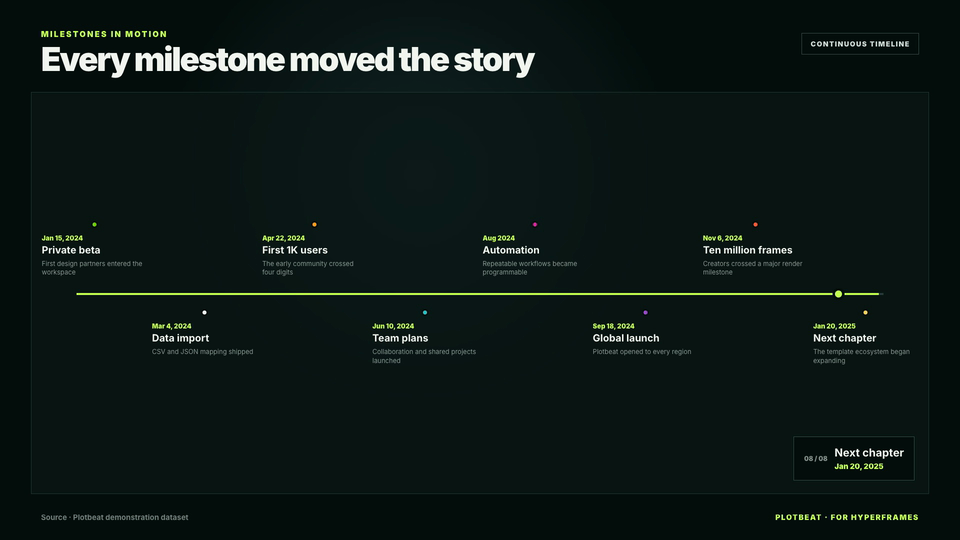
event rows data · date + title
Un parcours de production visible
The skill inspects dates, series, units, missing values, and the story your data can honestly support.
Start from a proven chart composition instead of rebuilding the same motion language every time.
Select a polished light or dark visual system, or build your own palette, typography, and composition tokens.
Your data is compiled locally into an ordinary, editable HyperFrames HTML project.
Check arbitrary seeks, tune the pacing in Studio, then let HyperFrames produce the final video.
Le moteur reste visible
Remove HyperFrames and the product stops working. That is the point: the skill specializes the engine instead of quietly rebuilding its timeline, preview, or renderer.
CORE ENGINEDirigez le mouvement
Choose the data and the narrative. The skill handles the repeatable setup, while you keep control of pacing, styling, and final Studio approval.
“Utilisez $plotbeat pour récupérer sur FRED les données mensuelles du chômage aux États-Unis sur les dix dernières années, citez la série et la date de consultation, puis créez un récit HyperFrames rapide à une seule courbe dans le style Studio Blueprint.”
“Utilisez $plotbeat pour créer depuis cohorts.csv une vidéo de classement multiligne dans le style Paper Cut. Classez les régions par utilisateurs actifs au fil du temps, affichez les huit premières et terminez par un tableau final épuré.”
“Utilisez $plotbeat pour récupérer dans le flux GeoJSON de l’USGS les séismes de magnitude 5 ou plus des 30 derniers jours, utilisez la magnitude comme valeur et créez une carte HyperFrames animée et rapide dans le style Signal Noir.”