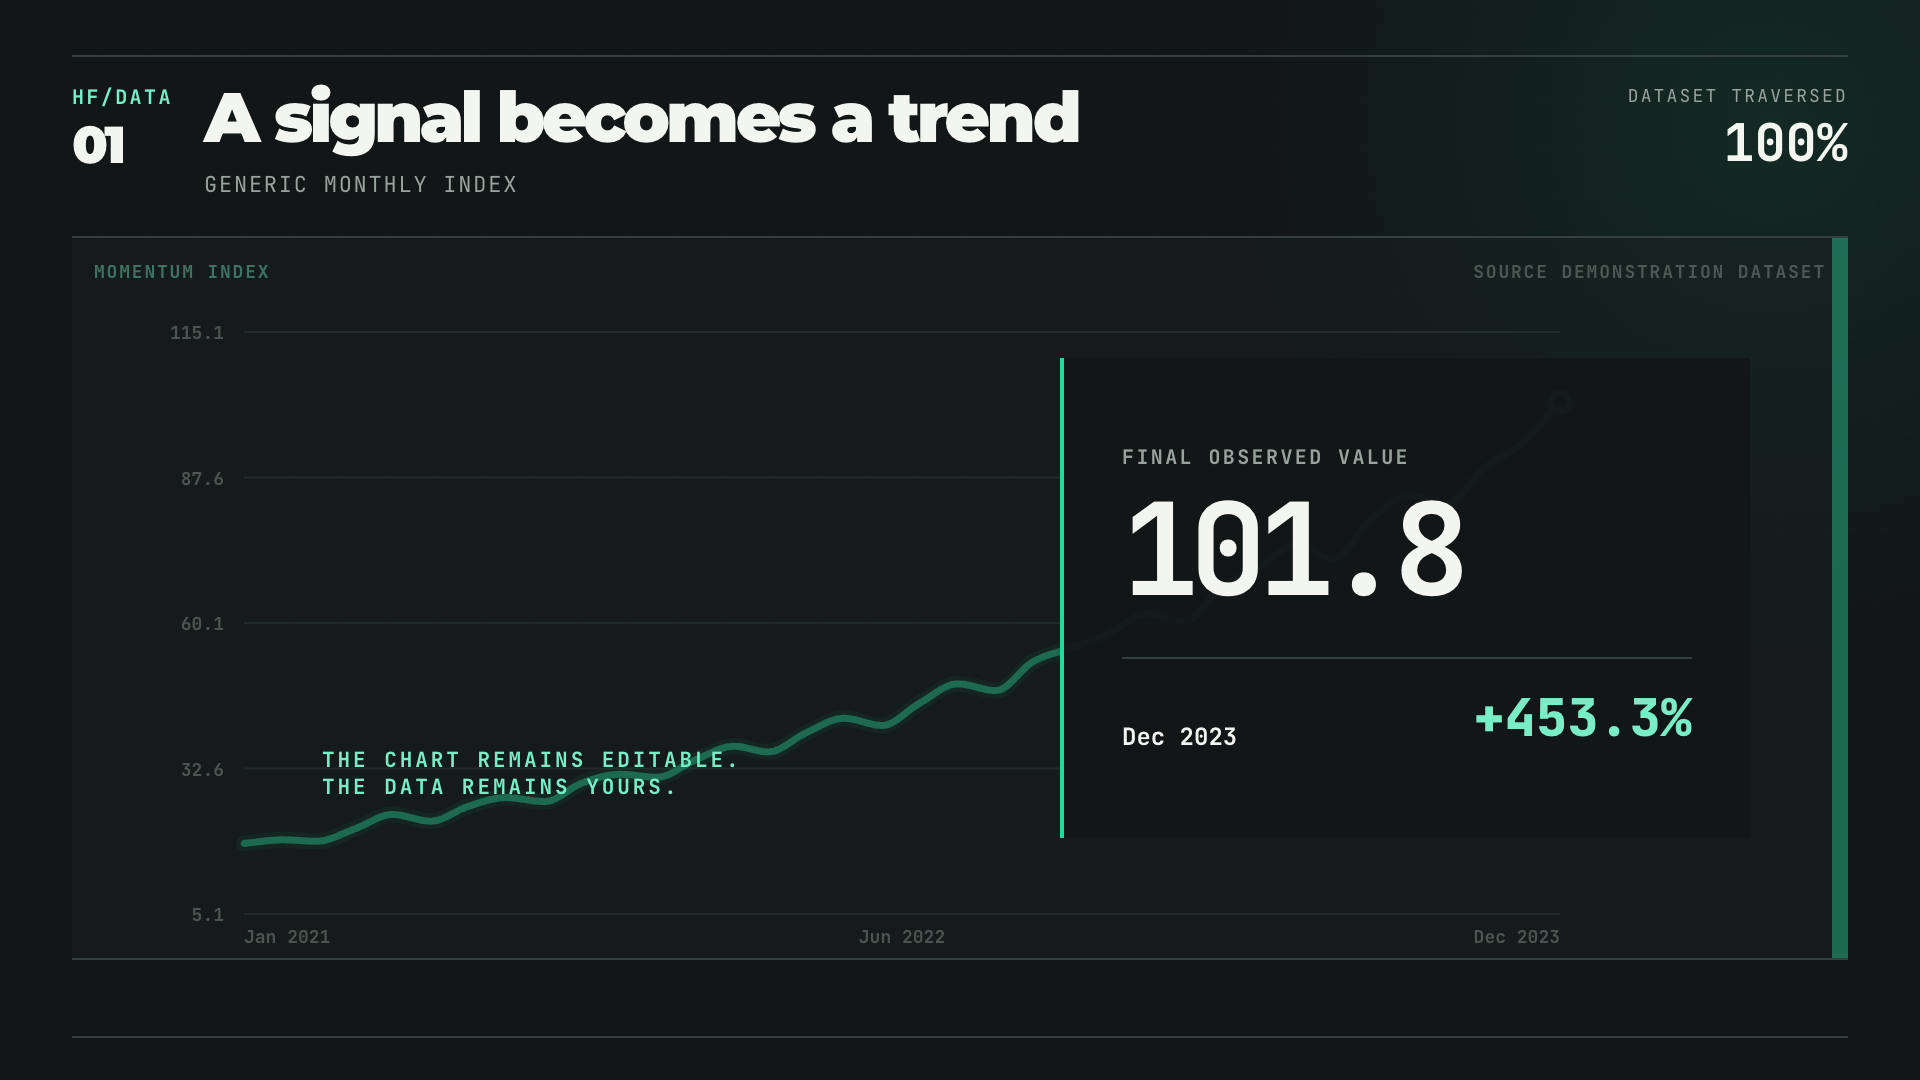
wide data · date + value
Single-line Story
A single time series grows across the frame with a live endpoint readout and a decisive final lockup.- Linear trace
- Smooth trace
Open-Source-Motion-Templates · Vorschau v0.1
Für deinen KI-Agenten. Angetrieben von HyperFrames.
Give your AI agent a CSV, JSON, URL, API, or named public data source. Plotbeat retrieves or maps the data into a reusable, editable HyperFrames video project instead of an opaque export.
Hier starten
Installiere Plotbeat und hänge eine Datei an oder nenne die Datenquelle. Der Skill übernimmt Abruf, Vorlage, Mapping, Timing, Prüfung und das HyperFrames-Projekt.
npx skills add heygen-com/hyperframes --all
npx skills add DbgKinggg/plotbeat --skill plotbeatNutze $plotbeat, um die monatlichen US-Arbeitslosendaten der letzten zehn Jahre von FRED abzurufen. Nenne Reihe und Abrufdatum und verwandle die Daten in ein schnelles, editierbares HyperFrames-Trendvideo. Hilf mir bei der Stilwahl und hole vor dem Rendern meine Freigabe ein.
Eine Grammatik · mehrere visuelle Systeme
Gleiche Daten. Andere Richtung.
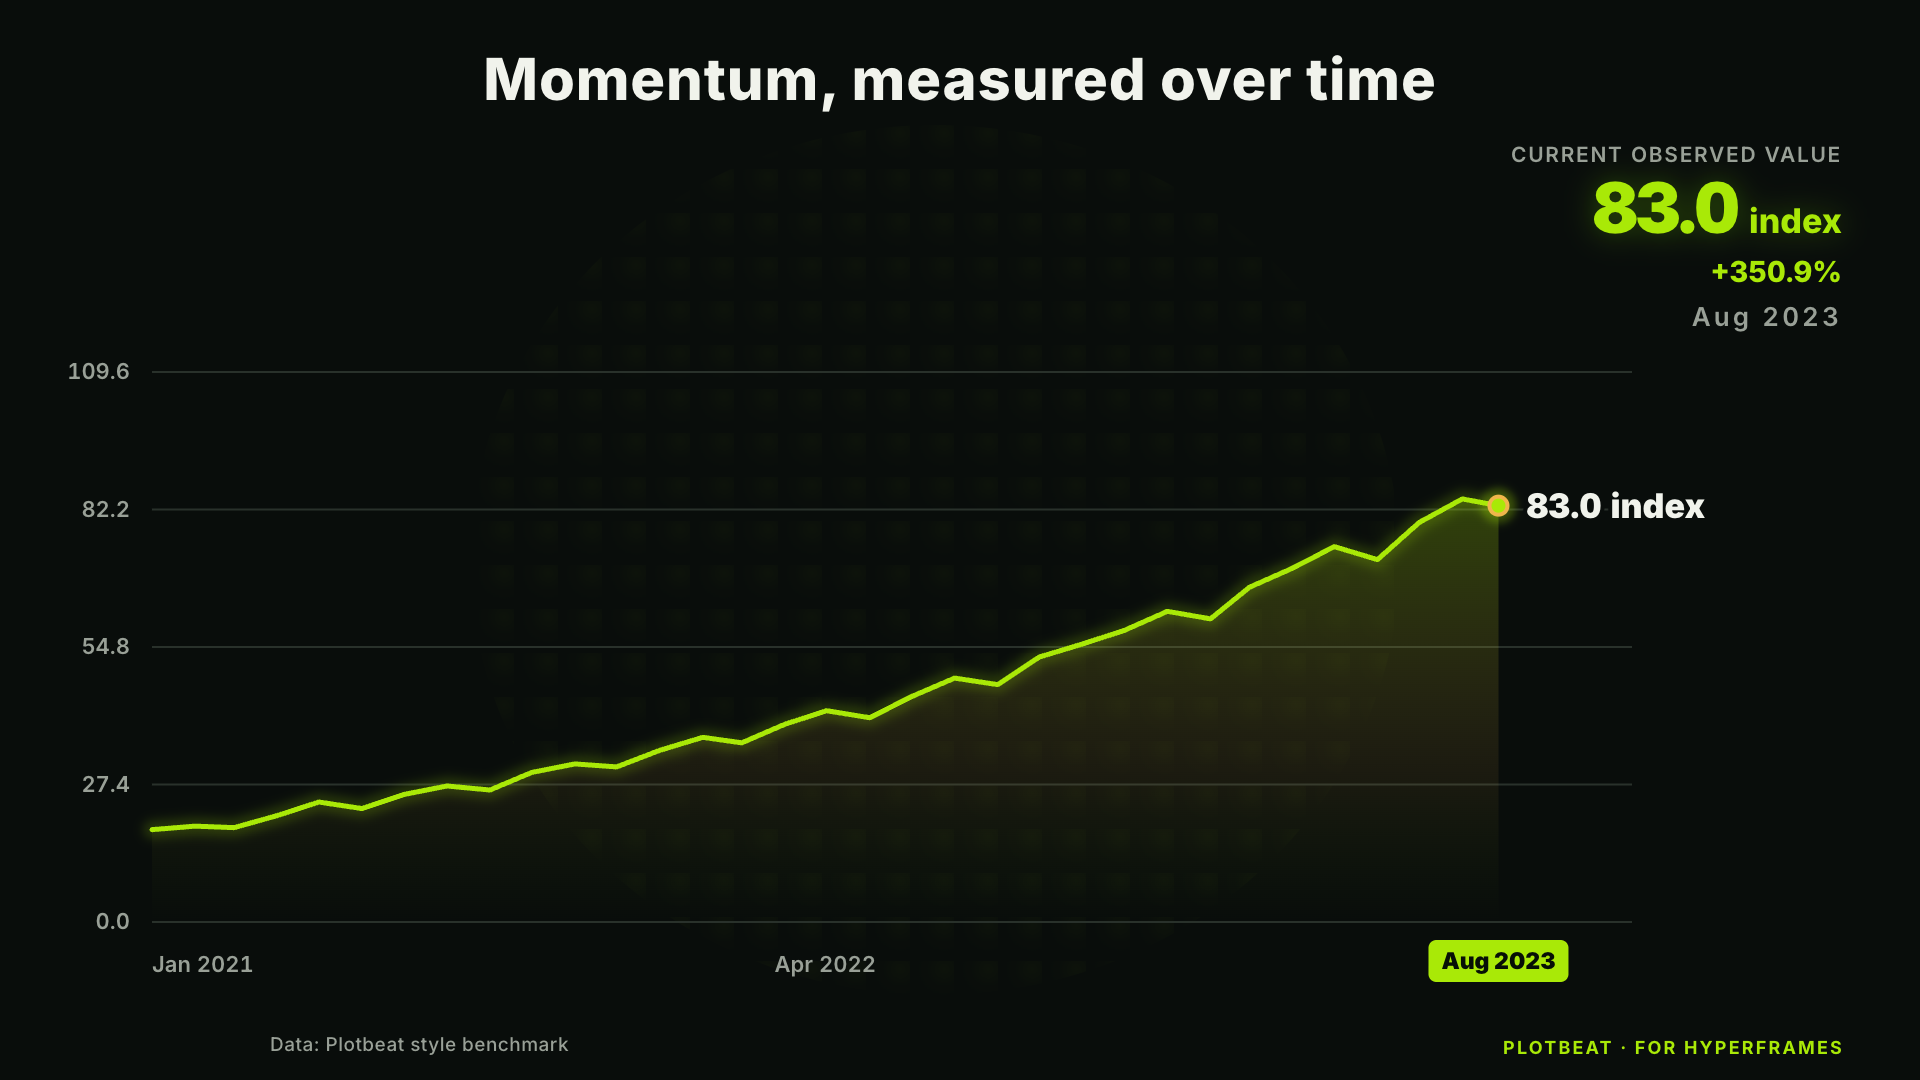
Zeilen rein.
Diagramm-Frames raus.
Rows enter as structured cells. A visible timing machine turns them into motion, then releases finished chart frames.
Motion-Grammatiken · 8 ready
Wähle eine Motion-Grammatik.
Every template is a real HyperFrames composition with frozen sample data, a clear input contract, seek-safe motion, eight visual styles, and a polished finale.
wide data · date + value
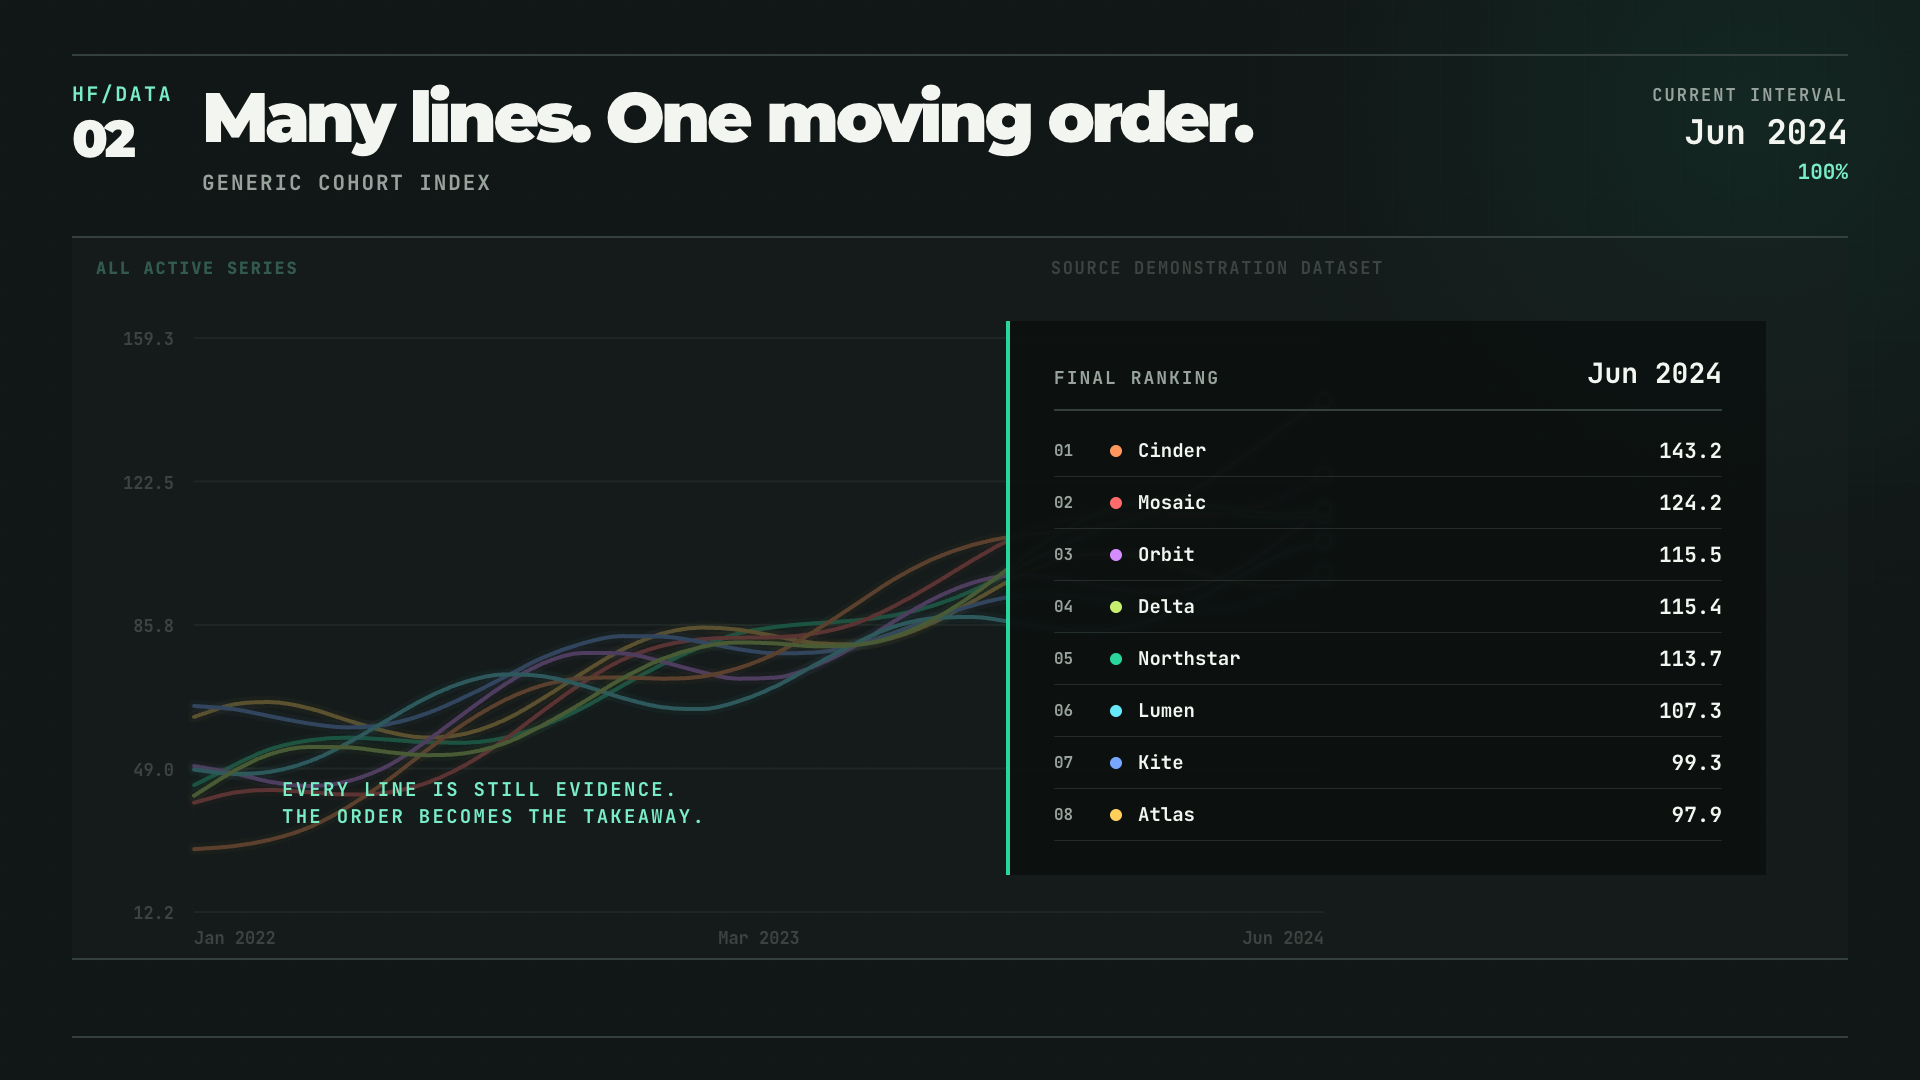
long data · date + series + value
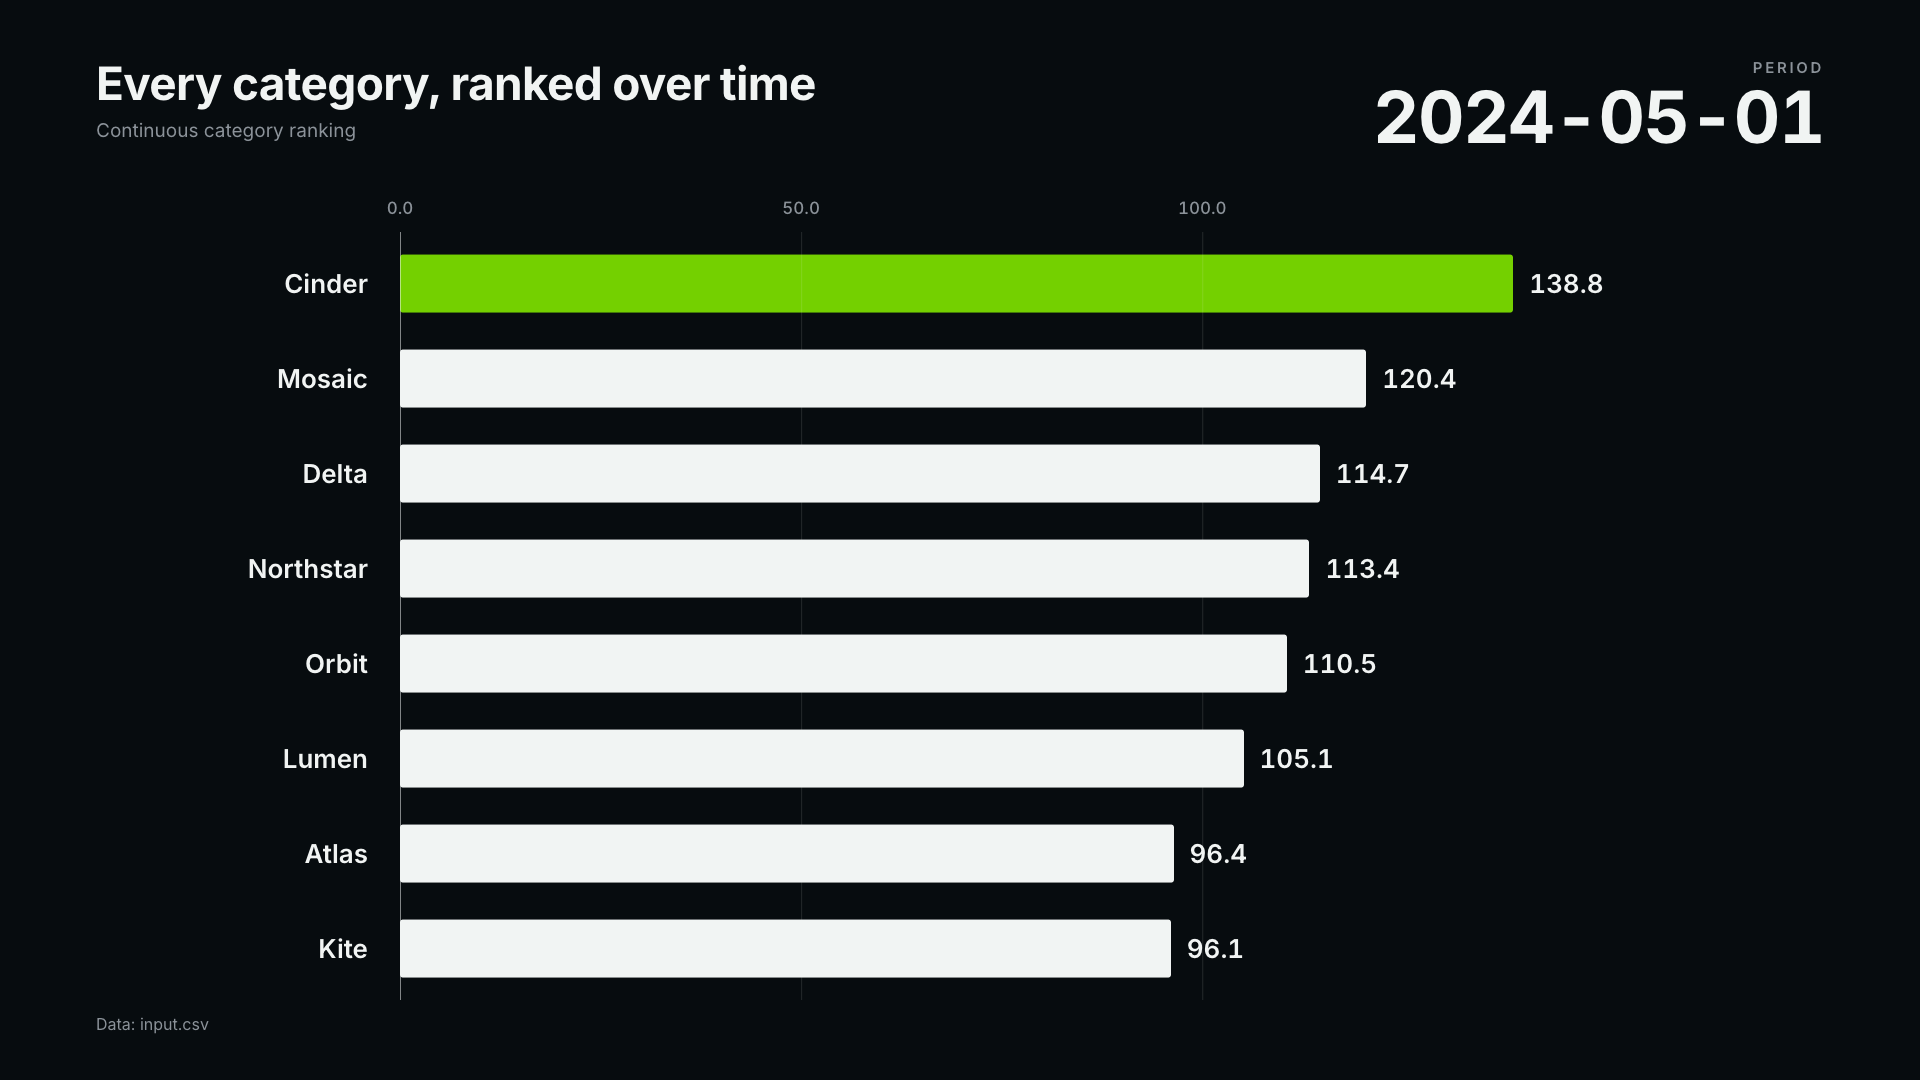
long data · date + series + value
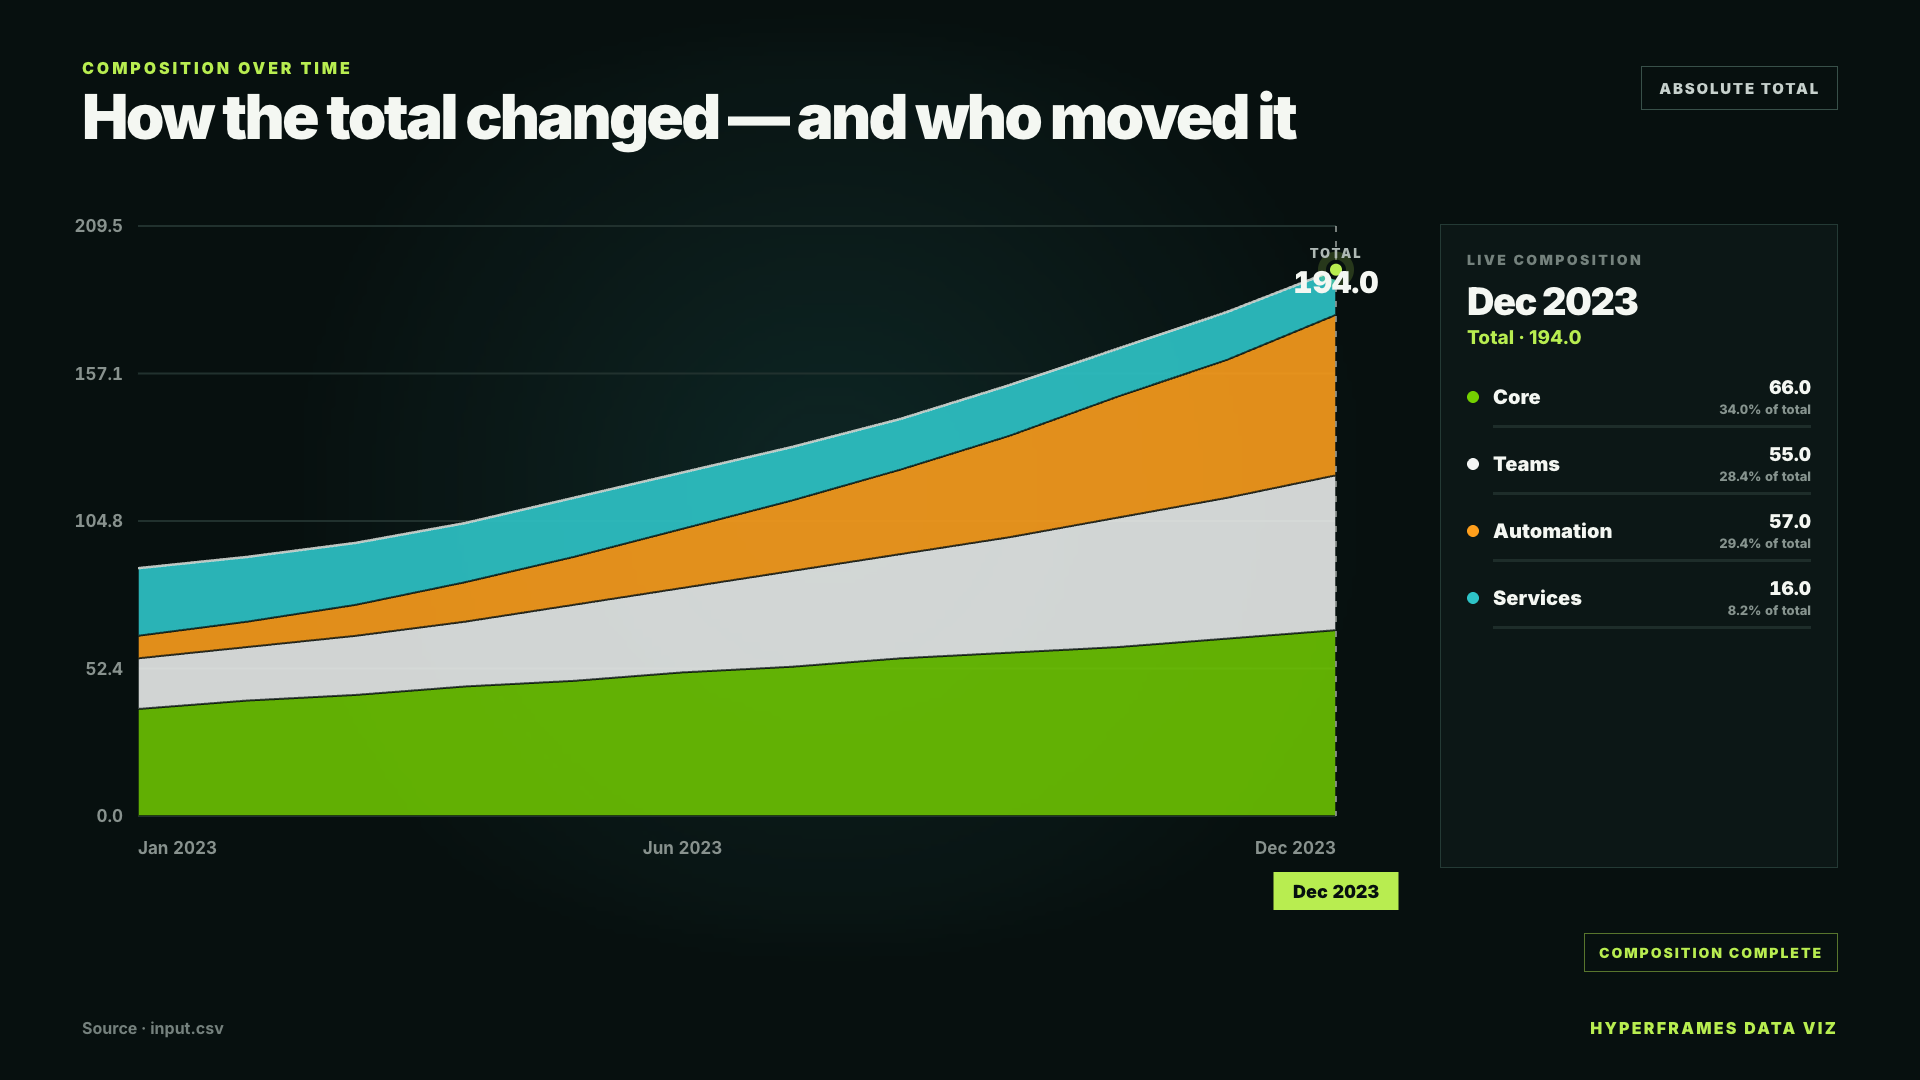
long data · date + series + value
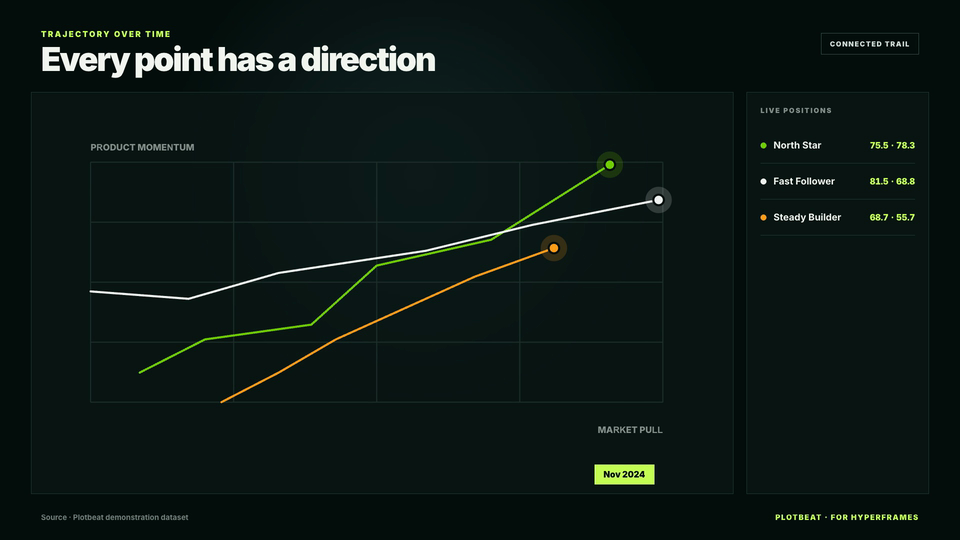
long data · date + series + x + y
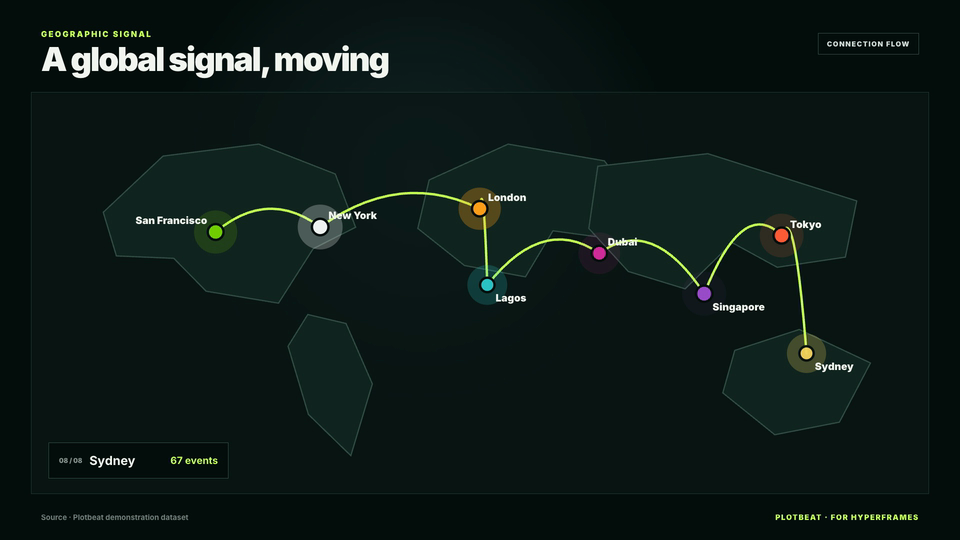
location rows data · location + latitude + longitude + value
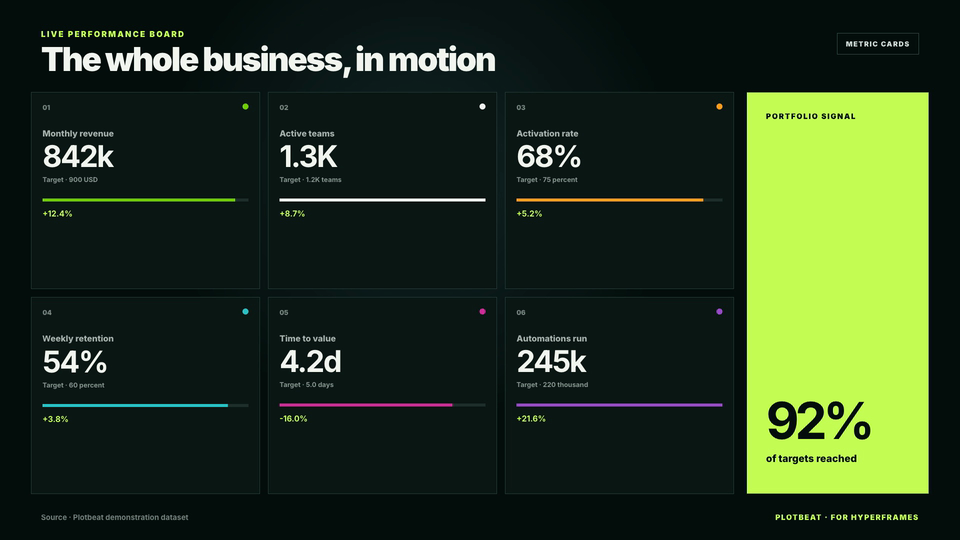
metric rows data · metric + value + target + change
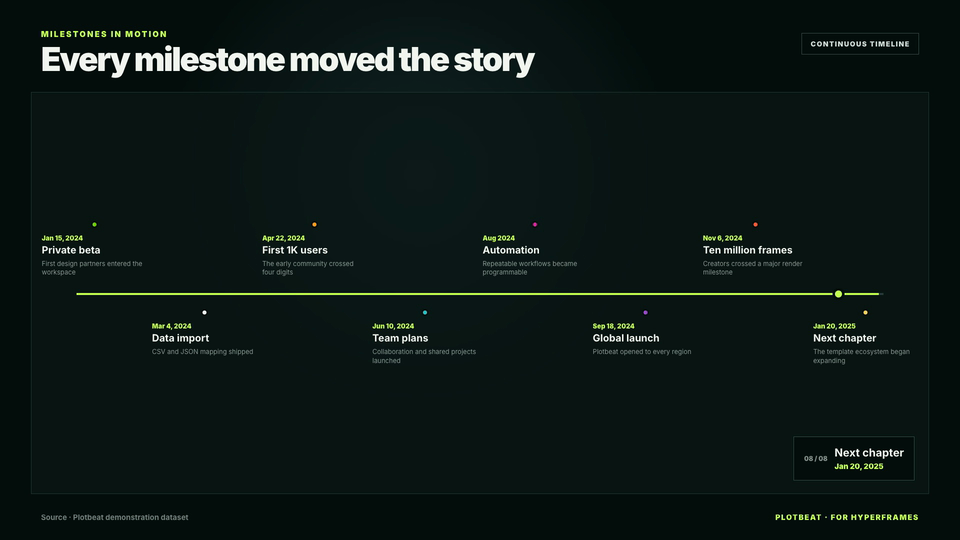
event rows data · date + title
Ein sichtbarer Produktionsweg
The skill inspects dates, series, units, missing values, and the story your data can honestly support.
Start from a proven chart composition instead of rebuilding the same motion language every time.
Select a polished light or dark visual system, or build your own palette, typography, and composition tokens.
Your data is compiled locally into an ordinary, editable HyperFrames HTML project.
Check arbitrary seeks, tune the pacing in Studio, then let HyperFrames produce the final video.
Die Engine bleibt sichtbar
Remove HyperFrames and the product stops working. That is the point: the skill specializes the engine instead of quietly rebuilding its timeline, preview, or renderer.
CORE ENGINEMotion dirigieren
Choose the data and the narrative. The skill handles the repeatable setup, while you keep control of pacing, styling, and final Studio approval.
“Nutze $plotbeat, um die monatlichen US-Arbeitslosendaten der letzten zehn Jahre von FRED abzurufen. Nenne Reihe und Abrufdatum und erstelle eine schnelle einlinige HyperFrames-Story im Stil Studio Blueprint.”
“Nutze $plotbeat, um aus cohorts.csv ein Mehrlinien-Rankingvideo im Stil Paper Cut zu erstellen. Ordne Regionen im Zeitverlauf nach aktiven Nutzern, zeige die besten acht und schließe mit einer klaren Endtabelle ab.”
“Nutze $plotbeat, um die Erdbeben der Stärke 5 oder höher aus den letzten 30 Tagen vom USGS-GeoJSON-Feed abzurufen. Verwende die Magnitude als Wert und erstelle eine schnelle animierte HyperFrames-Karte im Stil Signal Noir.”